PISA blindness. Why is Estonia not using the potential of its registry data?
- The Estonian education gap is the face of a child studying in a school with few resources and from a weak socio-economic background. The operating environments of schools vary greatly – some lack teachers, support specialists and learning materials, while others have them better secured. The question arises whether the lack of resources in schools is not forcing parents to increasingly compensate for the school’s shortcomings with their own funds.
- Tallinn is the region with the fastest educational stratification. In Tallinn, the relationship between the average income of schoolchildren’s mothers and fathers and their mathematics scores has consistently been nearly twice as strong as elsewhere in Estonia.
- Although Estonia is known as an e-nation, digital development has not reached the education landscape evenly. Register data, the use of which is hampered by both low awareness and increasingly stringent data protection requirements, would have long ago shown that educational inequality is deepening. However, PISA’s weak scientific basis softens or distorts the real picture.
INTRODUCTION
OECD definition1 According to the Equality in Education Act, educational equity does not mean that all students achieve the same results, but that their success should not depend on factors such as social or economic background, over which they have no control. The impact of students’ social background on their academic performance depends on age, gender and subject: background weighs more where the school has less influence (e.g. in reading), while school quality matters more in subjects such as mathematics and science. The deepening of educational inequality in Estonia requires bold steps to improve the quality of underperforming schools, and data-driven educational analytics has great but so far little-used potential in this regard.
PISA’S SOCIO-ECONOMIC STATUS MEASUREMENT IS DESERVING CRITICISM
Estonia has so far relied on the PISA test to assess educational inequality. However, the 2022 results, which showed a deepening of stratification (13% of the variability in mathematics results is explained by children’s home background), raise the question: is educational inequality really a new phenomenon in Estonia?2 It should be noted that the PISA background measure has also changed over time (most notably in the 2022 round) and direct comparison with previous results is not always adequate, although it is often done. We would like to emphasize that this article only addresses the adequacy of the PISA socio-economic background measure and does not in any way question the quality of the PISA academic tests.
International studies warn that the PISA background measure is drawing too far-reaching conclusions, so it cannot be said that students’ socioeconomic background is only now influencing results. In scientific literature, (blind) trust based on prestige and titles is called the prestige bias.3 We tend to trust people and institutions that have already achieved success or recognition in some field the most. This so-called trust highway works especially quickly in the case of international rankings, such as PISA. However, the actual reliability of the study is determined not by the authority of the institution or those responsible, but primarily by the methodological accuracy and timeliness of the study. Unfortunately, the high prestige of PISA has overshadowed the adequate treatment of internal inequalities in Estonia.4
In the scientific world, the so-called golden triad of measures of educational inequality is parental income, occupation and education. In the case of the PISA test, the measure of students’ home background is the status index (economic, social and cultural status, ESCS), which combines the social, economic and cultural background of the student into one variable. Researchers have emphasized that ESCS lacks a clear scientific basis: the classic socioeconomic triad includes parental education and occupation, but instead of family income, only household assets are used as a proxy indicator.5 The problem with the PISA socio-economic background measure lies primarily in the way the data is collected. Moreover, the assessment is based on a student survey, which is often not answered – as evidenced by German data – by children from poorer families.6 Below we take a closer look at what is problematic about the three components that PISA uses to measure students’ backgrounds.
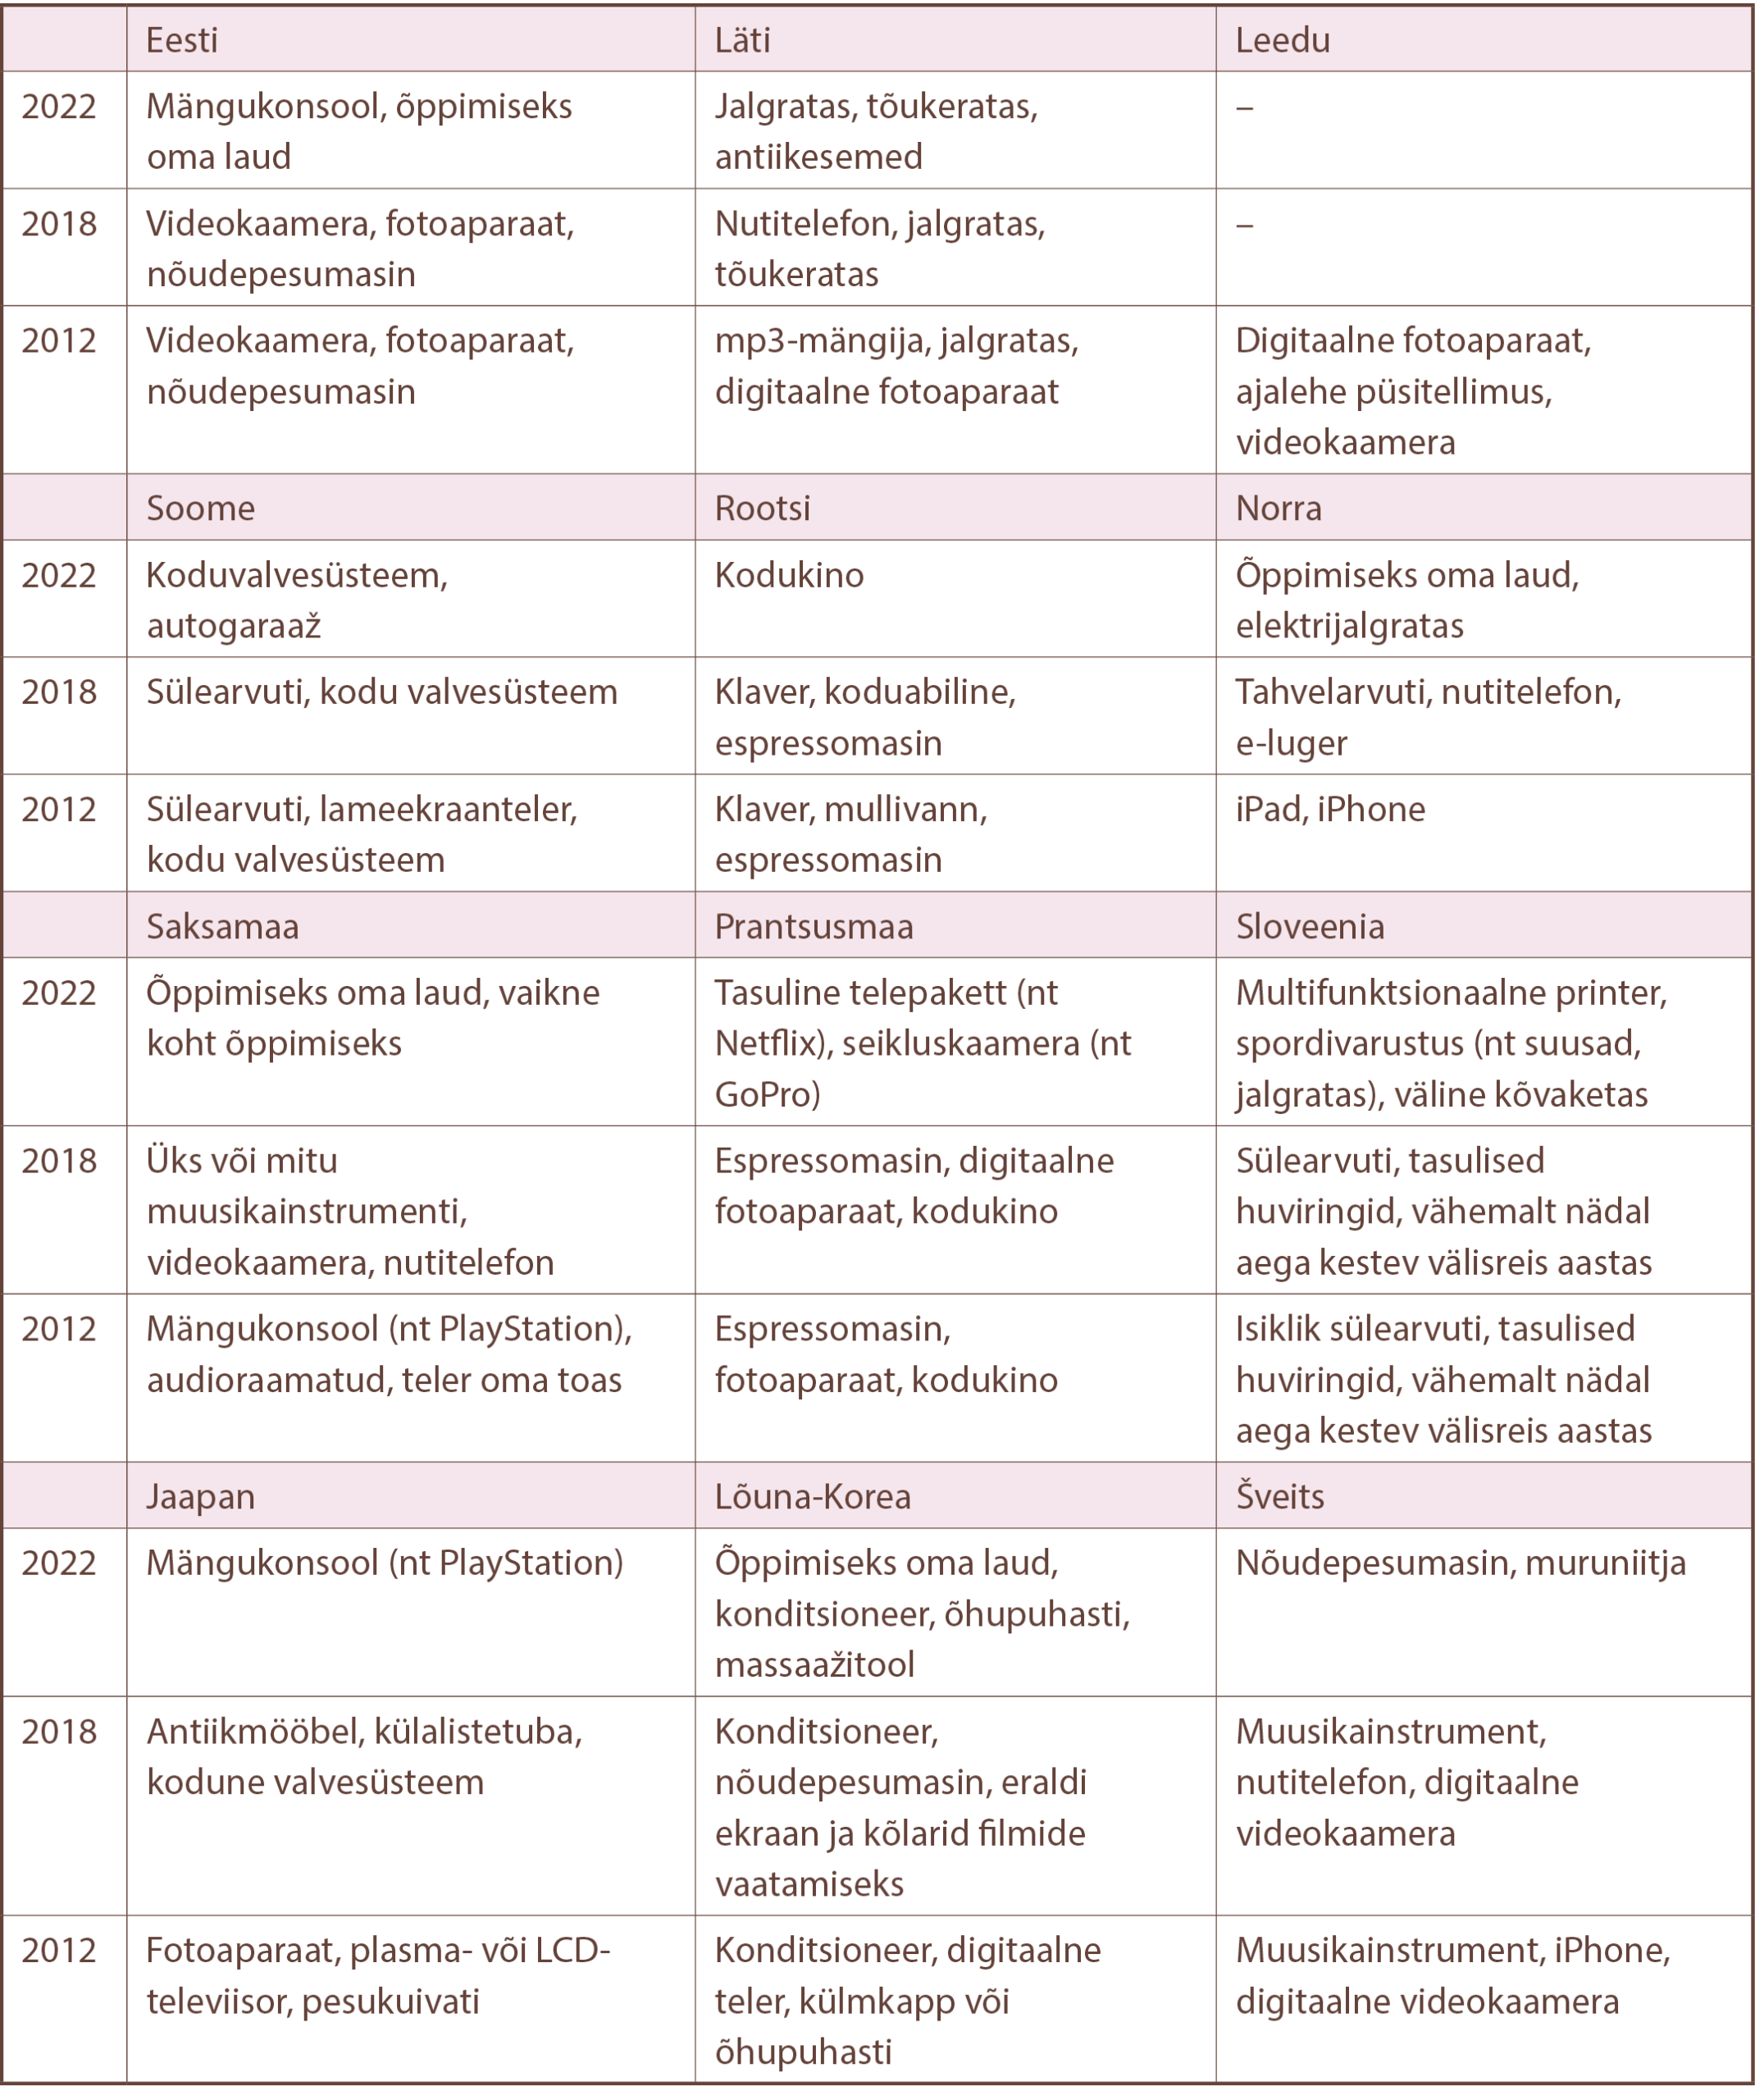
The economic component “household assets and resources” measures material well-being based on consumption habits – it is based on the items available in the homes of 15-year-olds.7 Students assess whether they have certain items at home (e.g. a desk for studying, their own room, etc.), including three items (see Table 2.2.1) that vary by country and that, according to PISA, indicate family wealth in a particular country.
According to a 2025 study by Kantar Emor, 56% of Estonians believe that small loans are granted too lightly, and nearly a fifth have taken out a consumer loan in the last three years.8 This calls into question the use of objects as a measure of wealth – for example, a PlayStation purchased on installments does not mean that the family will have the money to hire a private math tutor for their child if the child develops learning gaps.
It is classically believed that the number of books at home is an indicator of a good intellectual environment at home, which leads to higher student achievement. PISA indeed uses one of the test questions as well, asking how many books someone has at home. The question is broken down into even different types (e.g. religious books, literary classics, science books, technical manuals, etc.) and with an accuracy of 1–5, 6–10 and more than 10 books. Even the average adult would probably not be able to answer this question so accurately.
In the PISA study, students usually complete the background questionnaire themselves, while the parent survey is optional in some countries. Therefore, based on the data from the countries studied, it has also been possible to examine the extent to which the answers given by students and parents to the questions on the socio-economic background of the family differ. In the case of household items such as books and digital devices, the agreement between students and parents is less than 50%.11 The OECD itself acknowledges the problem: “Collecting data directly from parents may be impractical in large-scale surveys due to the costs involved. [—] Collecting data on parents’ occupations and educational attainment through students is a pragmatic solution, but questions may arise about the completeness and accuracy of the data collected.”12
The social component “parents’ professional status” is measured based on parents’ profession and job position. In general, students underestimate their parents’ professional status by about the same amount (20%) as they overestimate it (21%).13 In fact, the PISA reports themselves highlight that the proportion of missing and incorrect data is increasing over the years – the most common omission is the parents’ job title (e.g. in the UK and Germany, over 20% of students), with students from weaker socio-economic backgrounds doing this most often.14
Regarding the cultural component “parents’ level of education”, almost every third student gives different information than the parent himself; the parent’s education is underestimated (18%) more often than overestimated (13%). It is precisely students whose parents actually have a lower level of education who tend to overestimate the level of education of their parents.15
EDUCATIONAL INEQUALITY IS WORSENING, REGISTRY DATA WOULD HAVE SHOWN THIS LONG AGO
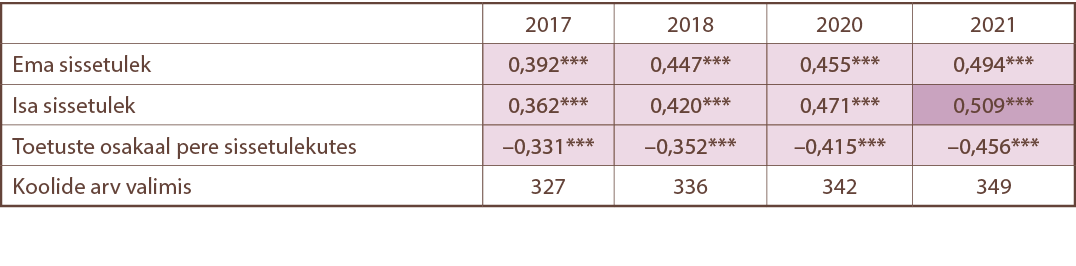
In Estonia as a whole, the relationship between parental income and school mathematics results has been getting stronger over the years (Table 2.2.2). While in 2017 the relationship between mother and father’s income was rather average, by 2021 it had reached a strong relationship. At the same time, the negative relationship between children’s exam results and the share of family benefits has also become stronger. The higher the share of benefits in family income, the weaker the mathematics exam results tend to be on average.
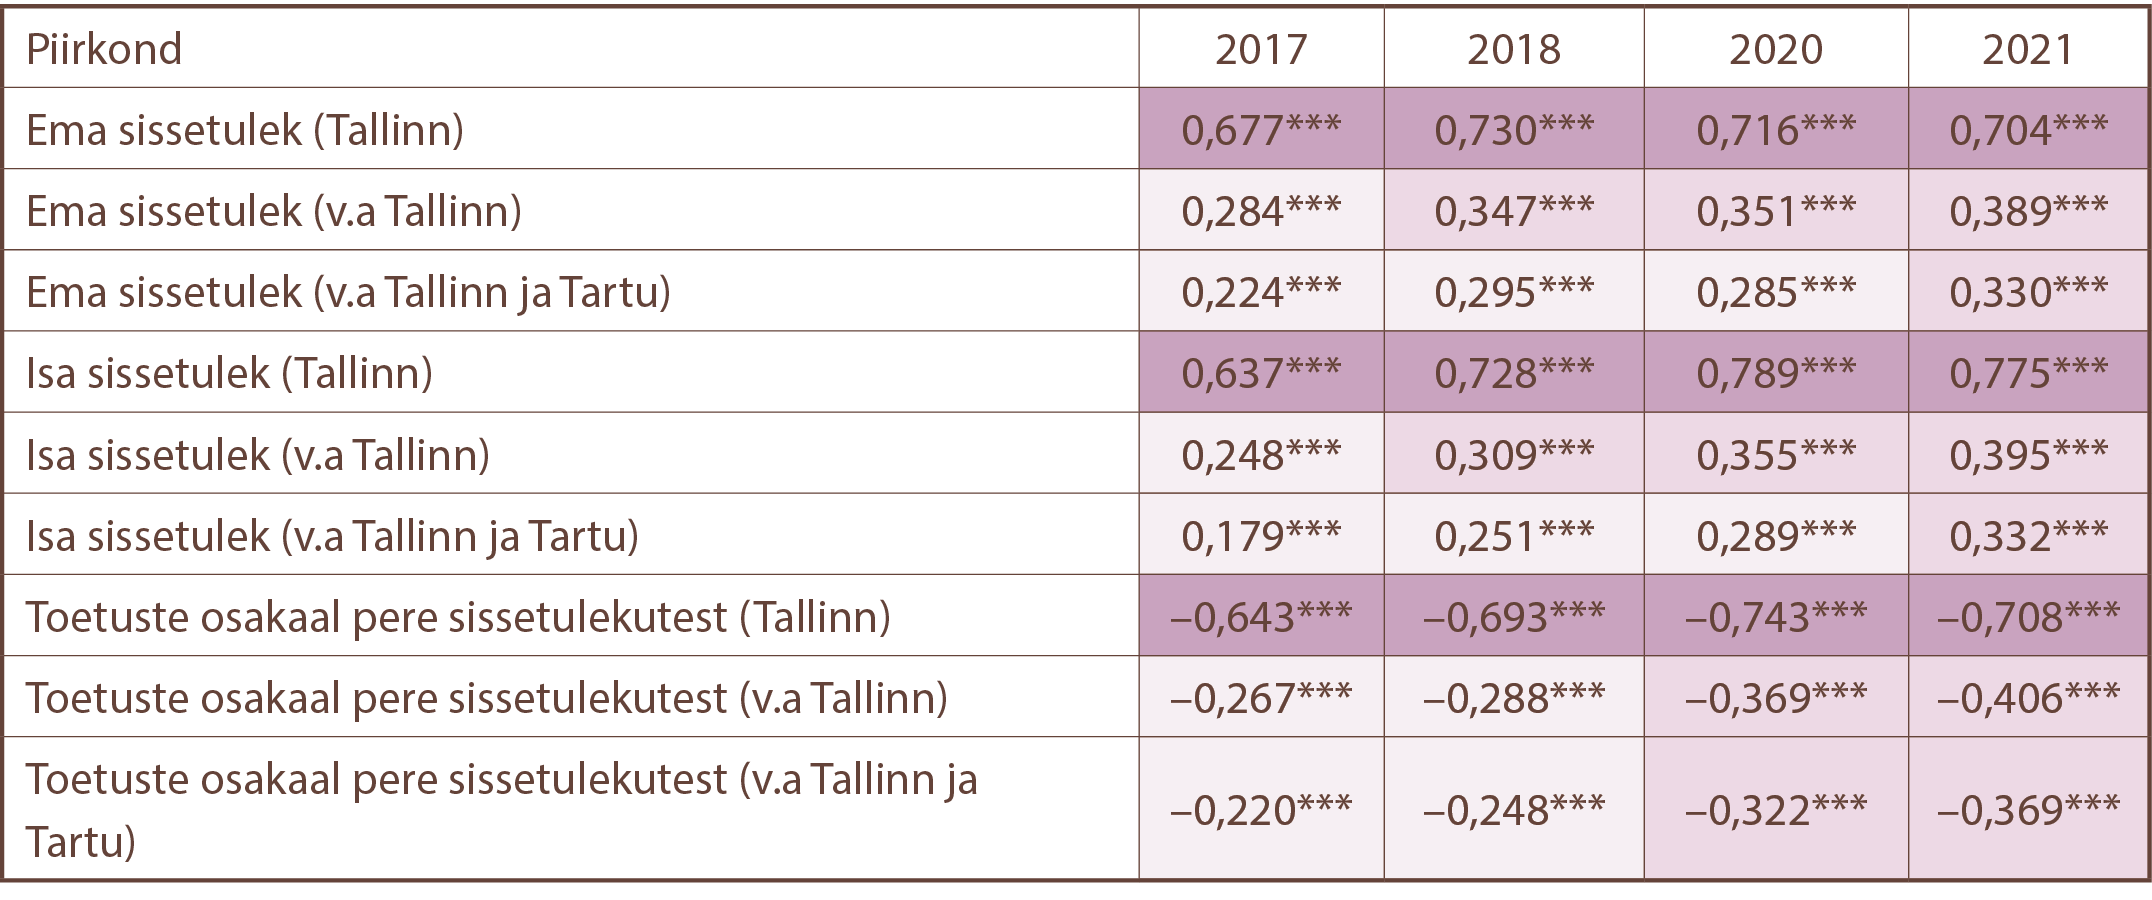
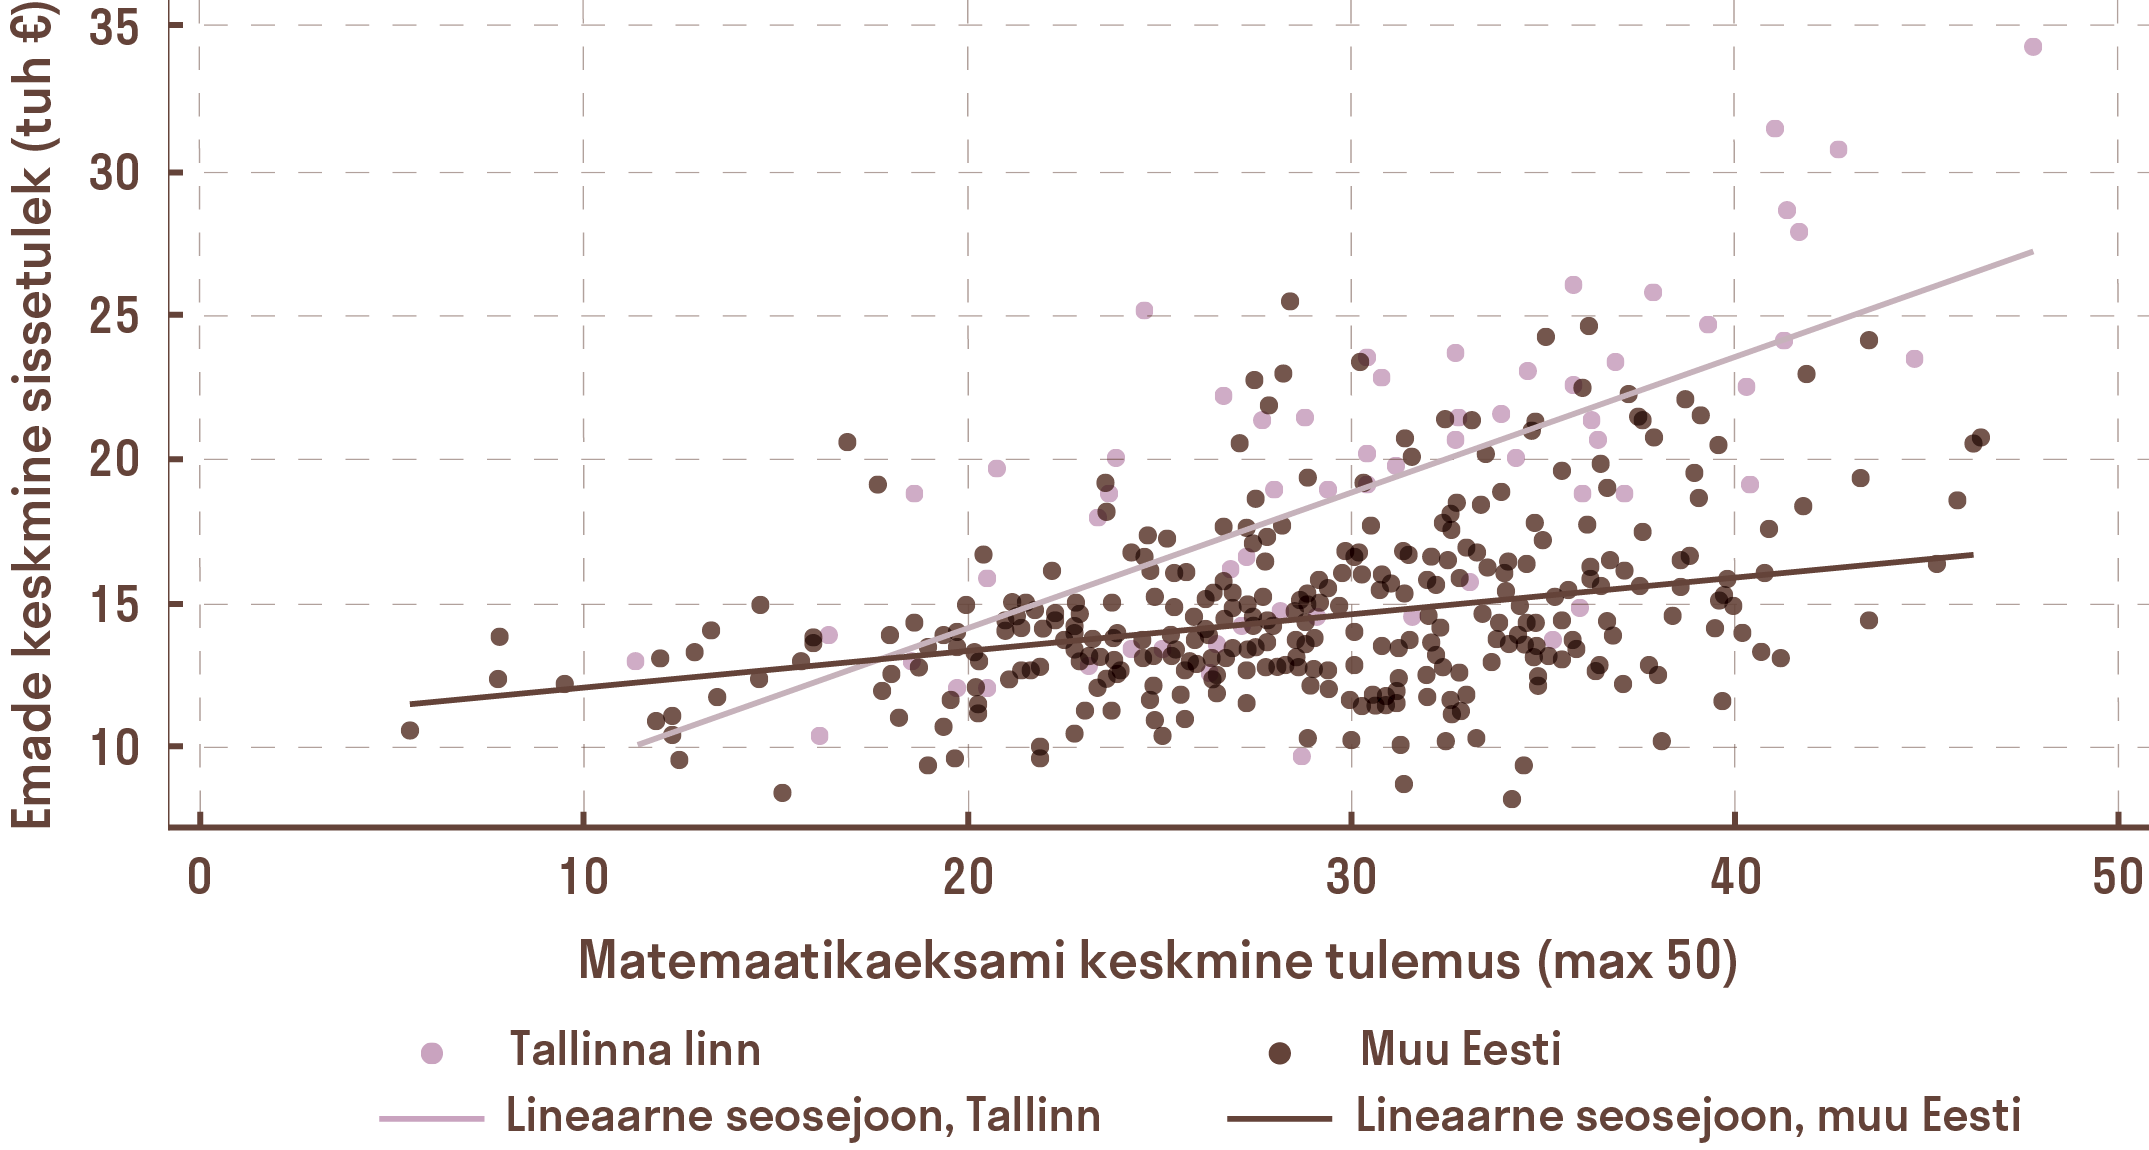
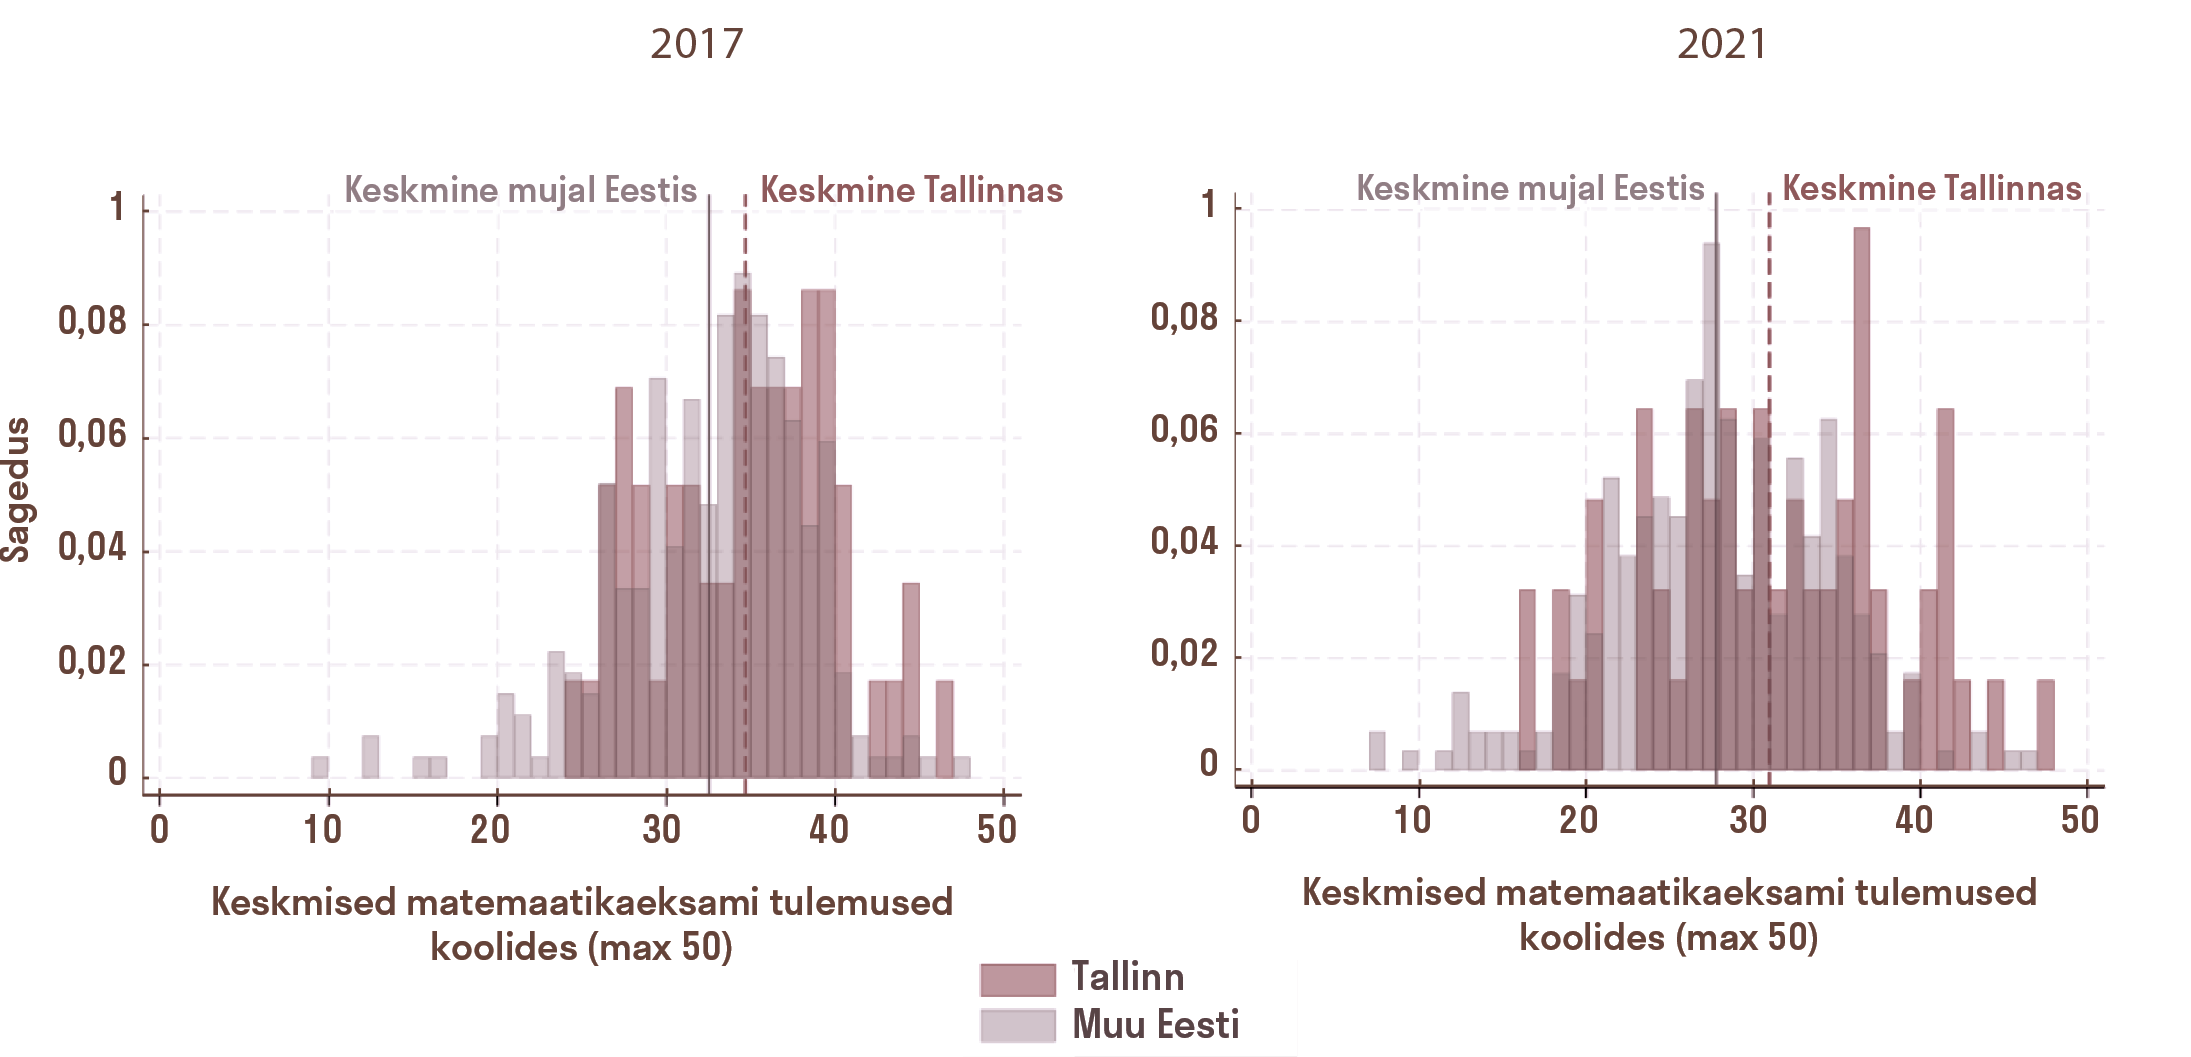
In Tallinn, educational stratification has deepened significantly over the years (see Table 2.2.3 and Figure 2.2.1). While the relationship between average school mothers’ income and average school mathematics exam results has remained stably strong in the capital, elsewhere in Estonia the same relationship has been almost two times weaker and has grown slowly. In 2021, average maternal income explained 24% of the variation in mathematics exam results across schools in Estonia, with 50% in Tallinn and 15% in the rest of Estonia.
Dataset. Statistics Estonia’s data on the income of parents (mother, father, family total) and the share of support in family income in 2017–2021 were supplemented with the average results of the mathematics basic school exam in general education schools (EHIS data) received from the Ministry of Education and Research. Statistics Estonia combined the data itself, and the results were sent to researchers in an aggregated form, i.e. as a school average. Time spent: 1–2 months for discussion of data protection rules and 6 working hours for combining the data (Statistics Estonia). Price: 360 euros, which Statistics Estonia spent on combining the datasets of different registers. Sample: It was possible to cover nearly 350 schools providing basic education with data from Estonian registers, where 12,000–14,000 students took the mathematics exam and graduated from grade 9 in 2017–2021. In these years, approximately 126,000–133,000 students were enrolled in basic education, depending on the year of study (sample for calculating the average income of parents). For comparison, PISA 2022 included 6,392 students from 196 schools. After the initial analysis, the authors also requested an extension of the income data series to 2024, but this was no longer possible due to stricter data protection rules.
The effect of fathers’ income is even clearer in Tallinn: there the relationship between math scores and fathers’ income has become very strong over the years, while elsewhere in Estonia it has remained only moderate. This means that the results of schools in the capital are increasingly dependent on the economic background of parents. A similar pattern emerges for subsidies.
While in 2017 the average school math score was mostly concentrated between 30 and 40 points, by 2021 Tallinn in particular has seen an increase in both weaker (even below 20 points) and stronger (40+) schools. This means that the inequality between schools in Tallinn has deepened (Figure 2.2.2). Therefore, in Tallinn, it can happen that within a radius of just a few kilometers, children get a completely different starting position for life – in one school the average math score is barely above 20 points, while a few kilometers away it reaches almost the maximum.
PARENTS’ EDUCATION LEVEL, MONEY OR GENES – WHAT MATTERS MORE?
The general hypothesis of socio-economic background indices is that parents’ education, occupation, and economic resources are directly related to children’s academic performance. The so-called gene lottery argument is often added here – as if families with higher status also have better genes. Let’s take a closer look to see if the picture is that black and white.
The impact of parental background, and especially educational level, on educational outcomes began to be discussed in more depth in 1966, when James S. Coleman and his colleagues published the report “Equality of educational opportunity”.16 This, as well as later studies, have confirmed that, in addition to school resources, family background and parental education played a more important role in shaping children’s academic performance.
Could this – the statement that children of educated parents are more academically successful – end the debate on the influence of socioeconomic background?
However, one must be critically sensitive to the times when bringing old studies into play – the national and social context has changed in the meantime, especially when comparing the Estonian education system with others. The argument is often based on the fact that studies conducted in the US in the 1960s–1980s17 showed the determining role of parental education, but this effect strongly depends on the interaction with other factors (family income, family structure, regional opportunities), which are different today. For example, a mother with a higher education who raises a child alone may not necessarily be able to compensate for the learning gaps that arise in a child in a poor school where there is a shortage of good teachers and support specialists. In short, a parent sometimes has to compensate for the relatively poor level of the school (compared to other schools). This does not mean that the level of education of the parents is not important, but it alone does not explain the whole picture or why children of parents with low education still reach higher education. What is considered important is the example of the parents – the extent to which they engage with their children and encourage them to learn.18 It is more often associated with educated parents, but it can also be the case for less educated parents.
The genetic lottery argument has also been extensively studied in science – do genes determine a child’s academic performance? Indeed, genes play a major role in why people differ in their math skills and general cognitive ability,19 but this does not mean that the environment does not have a significant impact. It is also not possible to assume that only gifted and genetically superior children are born into wealthier and educated families. Namely, the phenomenon of the “twice-exceptional” (2e) is also known in scientific literature – a child who is both very gifted or has a high IQ, but at the same time has special needs (e.g. dyslexia, ADHD, autism). Studies show that students from weaker socio-economic backgrounds are perceived as gifted significantly less often, which is why doubly exceptional children from poorer families often remain unidentifiable and without the necessary support. Giftedness and special needs can occur together and often mask each other, making it difficult to recognize both giftedness and special needs and provide support. For example, US studies show that students from the highest-income families are six times more likely to be identified as gifted than students from low-income families – meaning that doubly gifted children from poorer families are at particular risk of being overlooked.20 Therefore, by neglecting disadvantaged schools and children from weak social backgrounds in Estonia, we may lose a great many talented people.
The expression of genes depends largely on the environment, and educational institutions play a central role in this process – schools can act either as a force that smooths out inequality or, conversely, as a mechanism that amplifies it.21 For example, schools can be a driver of inequality if a systemic shortage of good teachers and support professionals primarily affects schools for students from low socioeconomic backgrounds. Relying on the gene lottery argument seems to deny the role of schools as environments in a child’s development – and even more so, it ignores children and young people who are born into poor families and attend schools that lack both the skills and resources to overcome their home backgrounds.
A higher socioeconomic background also gives the family a so-called compensatory advantage.22 A less capable child born into a family with a strong socioeconomic background is more likely to receive a good education than a gifted child from a weak socioeconomic background. Parents compensate for their children’s low academic performance by providing additional support (e.g. preschool, private tutoring, etc.)23 and also alleviate obstacles arising from possible genetic risks (e.g. learning or behavioral difficulties).24
A study of more than 29,000 pairs of twins in the Netherlands showed that the socioeconomic background of the family and school influences the expression of genetic risks, placing children from disadvantaged backgrounds at a double disadvantage.25 Their home environment does not adequately compensate for their risks, and they often attend school with few resources. Therefore, a favorable and supportive school environment may be crucial for them. Meta-reviews confirm that a safe school atmosphere, good relationships with teachers, high expectations, and fostering self-confidence reduce the negative impact of socioeconomic background.26 Dutch data shows that when a school raises the expectations and self-confidence of students from disadvantaged backgrounds, the impact is much greater than for children from wealthier families.27
Much has been written about the socio-economic background of students as a child’s home environment, but less is said about the socio-economic environment of the school, or the resources of schools. While the socio-economic background of students is mainly determined by the background of their parents, two dimensions can be distinguished at the school level: the socio-economic profile of the school (the sum of the backgrounds of students) and the school’s internal resources and quality indicators (including the quality of teaching and school management). Schools with students from low socio-economic backgrounds often have to cope with modest resources – there is a shortage of teachers, support specialists and teaching materials.28 Thus, these schools face a double disadvantage. The Estonian education gap is the face of a child studying in a school with few resources and from a weak socio-economic background. For example, the systemic shortage of subject teachers in certain schools worsens the chances of these students progressing, giving an advantage to students whose parents can provide a private tutor or have knowledge of the relevant subject themselves. It is precisely the spread of so-called shadow education, or the market for private tutors, that is often an indicator of educational inequality.29
So how do we resolve the debate about what is more decisive in a child’s development – the mother’s education, the family’s wealth or genes? Education is a complex system, where no single factor alone determines success: if one link is weak, others must balance it out. In Estonia, however, it is worth asking to what extent the educational gap is exacerbated by differences in school resources – a shortage of teachers and support specialists, limited opportunities to purchase high-quality textbooks or equip laboratories – and whether this does not increasingly force parents to compensate for school shortcomings with their own expenses or through educational migration (searching for a better school).
SUMMARY: WHAT NEXT?
In Estonia, there is a strong need to differentiate teachers’ salaries by subject, with the goal of also improving the quality of teaching in these subjects. Why is it important to look at alternative job opportunities for subject teachers? Studies in other countries show that teachers earn an average of 23.5% less than other specialists with the same level of education – this is called the teacher pay gap.30 This is most acute for science teachers, whose skills are highly valued in the job market and often better paid outside of school. However, there are also subjects where teaching offers a salary advantage and is the best career choice.
Based on the example of those who studied to become mathematics teachers in Estonia, it is known that in 2024, a mathematics teacher with a specialized education who was not working in a school earned approximately 1.6 times (2,838 euros) more than the minimum teacher salary (1,820 euros in 2024) in Harju County, 1.4 times (2,573 euros) in Tartu, and 1.3 times (2,459 euros) in the rest of Estonia.31 Research has found that raising the salaries of science teachers in particular can reduce their turnover rate by 18–28 percent.32 The Basic and Upper Secondary School Act stipulates that upon graduation, knowledge in selected subjects is tested – primarily mathematics, Estonian and a foreign language – so we have already made certain subjects more important than others on a national level. Therefore, these subjects play a decisive role in shaping the future educational path of young people.
Data-driven education policy. Estonia has excellent registers to address the education gap in a targeted manner, but for years, if not decades, we have been limited to conclusions drawn from PISA background surveys. This has led us to a kind of PISA blindness when it comes to the education gap. Today, too, it is necessary to apply Estonian register-based information much more vigorously in order to design targeted interventions to reduce the education gap. It is especially important to take into account the socio-economic background of schools in the analysis of the education gap – for example, the level and availability of teachers, the quality of school management, the presence of support specialists and the ratio of students to teachers. Unfortunately, the potential of Estonia’s e-government in education is hampered by a lack of awareness of existing data (we are busy conducting new and time-consuming survey studies rather than using register data), but even more so by increasingly strict data protection rules.
Systematic use of register data should be the foundation of education policy, both for monitoring education and for planning changes. For example, the design of teachers’ career and salary models must be based on a holistic data-based view, not just on formal qualifications. Otherwise, we may end up with a situation where mathematics is taught by a qualified history teacher who has no mathematics qualifications, while a working engineer with very good teaching skills who wants to make a career change appears less valuable in the eyes of the system because he does not have a document proving his teaching qualifications.
We could even consider linking the results of the PISA academic test with Estonian registry data to analyze both the background characteristics of the participating schools and the socio-economic background of the students and to track developments over time – for example, what has become of the top PISA performers ten years later, whether the results of the schools have improved or deteriorated, and what characteristics characterize the top-performing schools – not for the purpose of international comparison, but primarily for the purpose of better understanding the Estonian situation.
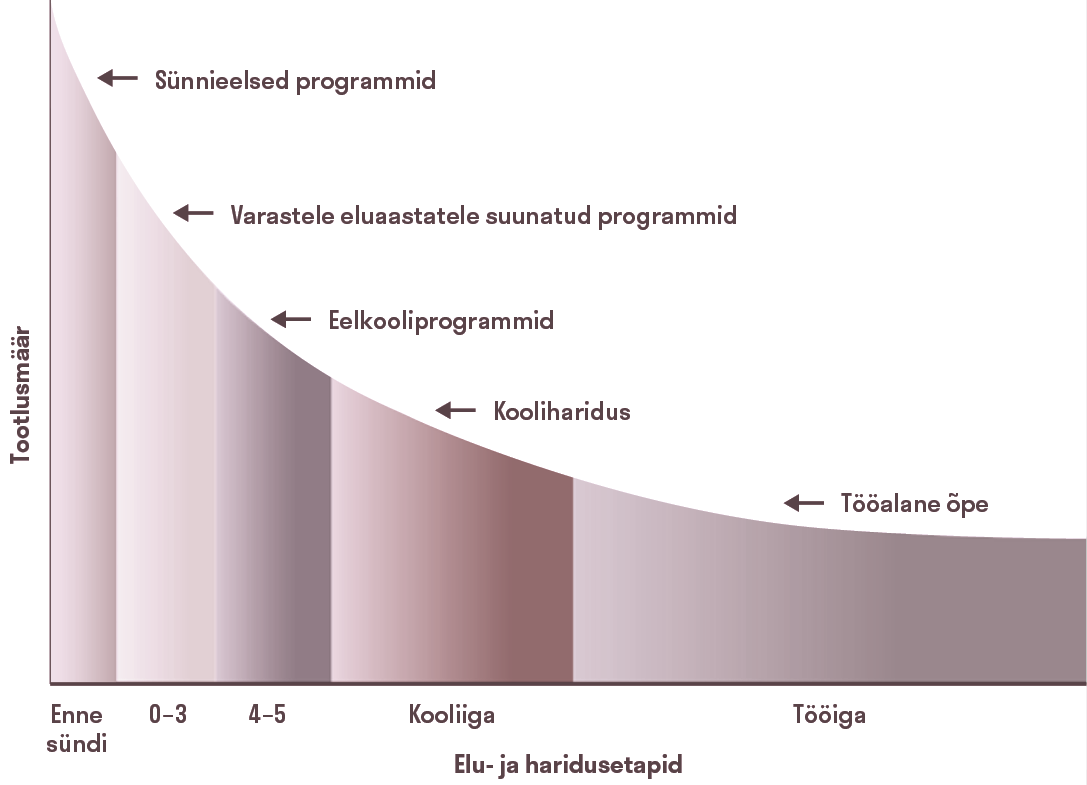
The quality of the teacher is most decisive for students from weak socio-economic backgrounds. We must also dare to ask what the impact of a poor teacher and school is on the student’s future. Nobel laureate James J. Heckman has emphasized that educational equity is not only a social issue, but also an economic one – supporting disadvantaged children increases society’s productivity and reduces future costs (e.g. unemployment, crime)33, which is why preventing educational inequality is many times cheaper for society than repairing the damage later. As the Heckman figure on the cost-effectiveness of education (see figure 2.2.3) shows, it is most profitable for the state to invest in the development of children from low socioeconomic backgrounds at a very early age.
Research has also concluded that the impact of students’ social background on academic performance is not uniform across countries: it depends on age, gender, and even the subject. In general, a student’s home background is more important in subjects where the school has less influence (e.g. reading), while the quality of the school determines results in subjects that the school itself shapes more (e.g. mathematics and science).37 Therefore, it is worth paying much more attention to the quality of schools in Estonia, especially when it comes to teaching science subjects, focusing on teaching materials, the quality of teachers and teaching, the competitiveness of salaries, the size of classes in these subjects, etc. In addition, we must not forget the quality of school management – even the best teachers cannot realize their potential if the school’s work organization and management are poor.36
