Local schools and sustainable mobility as prerequisites for independent school travel
- About half of Estonian pupils attend school in a different settlement unit from where they live, which limits their ability to travel to school independently.
- Regional differences in public transport provision and segregation within the school network create unequal opportunities for independent school travel.
- Many pupils travel to school by car, but improving the availability and social acceptance of public transport would support children’s independent mobility.
INTRODUCTION
Estonia is characterised by high car dependency: the number of vehicles per capita is among the highest in the European Union, and car use continues to increase.1 In 1997, there were 306 passenger cars per 1,000 inhabitants in Estonia; by 2024, this figure had risen to 635. In 1997, 28% of people travelled to work by car, compared with 59% in 2024. Over the same period, the share of people walking to work declined from 30% to 14%, and the share using public transport from 34% to 18%.2 Over the past 25 years, car ownership and use have thus doubled, while the use of sustainable modes of transport has fallen by a similar margin. Here, sustainable modes of transport refer to public transport, walking and cycling, as these have a significantly smaller environmental footprint and greater health benefits than travelling by car.
The rise in car use can partly be explained by urban sprawl, which has increased the distance between home and workplace and led people to live in areas where public transport is either unavailable or not competitive with the car, owing to infrequent departures or routes that do not meet individual needs. It is also linked to rising prosperity, a culture and lifestyle that favour car use and increased parental control.
Although commuting patterns among working adults are relatively well documented in Estonia, there is very limited data on how children travel to school. Does the broader trend of motorisation also shape pupils’ mobility habits? Daily school-choice-driven mobility is influenced by school choice and the location of home and school, parents’ mobility preferences, levels of parental control and perceived safety, social norms and practices, the availability and organisation of public transport, traffic culture and safety, and other factors. This article examines patterns of school-choice-driven mobility in Estonia and the extent to which sustainable modes of transport are used. Understanding pupils’ daily mobility is important not only for addressing current sustainability and child health challenges but also from a longer-term perspective, as present mobility habits shape future behaviour.
Data and methodology. We analysed school mobility – that is, commuting between pupils’ homes and schools – using three datasets: Statistics Estonia data on commuting between pupils’ homes and schools (2020),3 the Estonian Residents’ Mobility Survey 20214 conducted by the Transport Administration and the Estonian Student Growth Study (COSI) 20225 conducted by the Estonian Institute for Health Development.
The analysis of the Statistics Estonia dataset was conducted within the framework of the national spatial plan ‘Estonia 2050’ and its synthesis study on settlement development scenarios.6 Origin–destination matrices based on the location of home and school by settlement unit relied on Population Register data. In Tallinn and Kohtla-Järve, city districts are treated as settlement units. Commuting results are presented by urban regions – that is, commuting centres and their surrounding functional areas. Functional areas were identified based on commuting flows to the local centre, distinguishing the immediate zone, transition zone and peripheral zone (where respectively > 30%, 15–30% or < 15% of the working-age population commute to work in the local centre).
For the analysis of pupils’ modes of travel, we used data from the Estonian Residents’ Mobility Survey.7 We examined school journey distance and modes of travel among respondents identified as pupils (N = 754). In the travel diaries, origin and destination were recorded at the level of settlement units. If a journey comprised several stages using different modes of transport, the mode covering the longest distance was recorded as the overall mode of travel. Where distance was not reported, it was calculated as the distance between the centroids of the origin and destination settlement units.
We also used data from the 2022 Estonian Student Growth Study8 conducted by the Institute for Health Development. In this survey, parents of pupils in Grades 1, 4 and 7 (N = 4,225) were asked about the mode of travel between home and school, the distance to school and the reasons why the child does not travel to school on foot or by other non-motorised means.
CHILDREN’S DAILY MOBILITY CHOICES ARE SHAPED BY PARENTS, THE ENVIRONMENT AND THE SCHOOL NETWORK
Schoolchildren’s daily mobility largely consists of routine travel between home and school. A central issue is whether pupils can travel independently. Independent school travel is closely linked to sustainable mobility. Over short distances, children can walk or cycle. Over longer distances, independence depends on access to public transport. Using public transport usually involves walking to and from stops, meaning that these journeys entail more physical activity than travelling by car.9 An active school journey supports children’s physical activity,10 and research increasingly explores its links with mental health.11 A study conducted in Estonia shows that more physically active children report being happier and more cheerful.12 Despite these benefits, active school travel has declined in developed countries, including Estonia.13
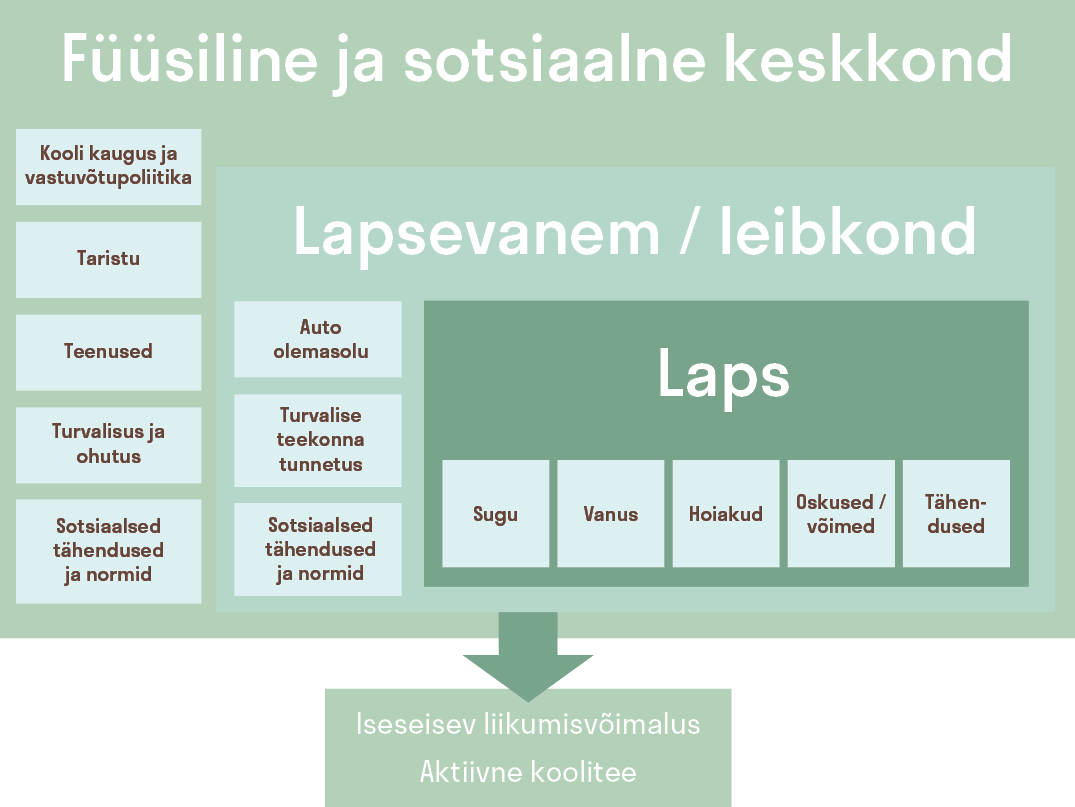
Research typically distinguishes three levels influencing children’s choice of travel mode: the child, the household and the environment.14 At the child level, independent mobility is associated with gender (boys are more likely to travel independently) and age (older children are more likely to do so).15 The child’s own attitudes also matter, including whether travel is perceived as enjoyable and useful.16 Parents’ attitudes are equally important: whether they believe their child can manage the journey alone, how they view walking or cycling, how they perceive social norms, and how much control they wish to exercise over their children’s activities.17 Car ownership within the household further reduces the likelihood of independent and active school travel.18
Although higher levels of education and awareness are often assumed to lead to more environmentally responsible consumption behaviour and mobility choices,19 awareness does not necessarily translate into sustainable daily behaviour.20 Higher parental educational attainment therefore does not automatically encourage sustainable travel modes among children. Daily travel choices are not purely rational decisions based on weighing costs and benefits. Rather, they reflect socially acquired habits shaped by individual capacities and skills, the meanings attached to mobility, social relations and the physical environment and transport infrastructure.21
In the physical environment, journey length and duration, along with perceived safety, are particularly influential. Distance is the key determinant of active school travel.22 Safety concerns relate both to traffic conditions and to the surrounding social environment. The longer the journey and the more unsafe traffic or surroundings are perceived to be, the less likely children are to walk or cycle to school.23 Over longer distances, public transport becomes central. Its use depends on reliability, frequency, comfort, travel time and network coverage. The more it requires walking, waiting and transfers, the less attractive it becomes. Younger people generally use public transport and active modes more than older people, but families with young children tend to prefer the car.24
Some studies suggest that schoolchildren’s travel mode is primarily shaped by the availability and quality of public transport.25 Other research indicates that school admission policies may have an even stronger effect. If a child cannot obtain a place in a nearby school, car use may become unavoidable.26 School choice is also linked to educational segregation: where the school network is stratified, parents often seek schools with pupils from similar socio-economic backgrounds or with a stronger reputation.27 This frequently leads to enrolment in schools located further from home, which reduces opportunities for active and independent school travel.
In summary, children’s travel choices are shaped by multiple interacting factors whose effects combine in context-specific ways (Figure 6.2.1). Mobility habits formed in childhood often persist into adulthood.
Understanding the daily school-choice-driven mobility of Estonian pupils is therefore important for reducing the environmental impact of transport, addressing the climate crisis, supporting children’s physical activity and shaping future mobility patterns.
ABOUT HALF OF ESTONIAN PUPILS LIVE AND STUDY IN DIFFERENT SETTLEMENT UNITS, WHICH LIMITS THEIR INDEPENDENT SCHOOL TRAVEL
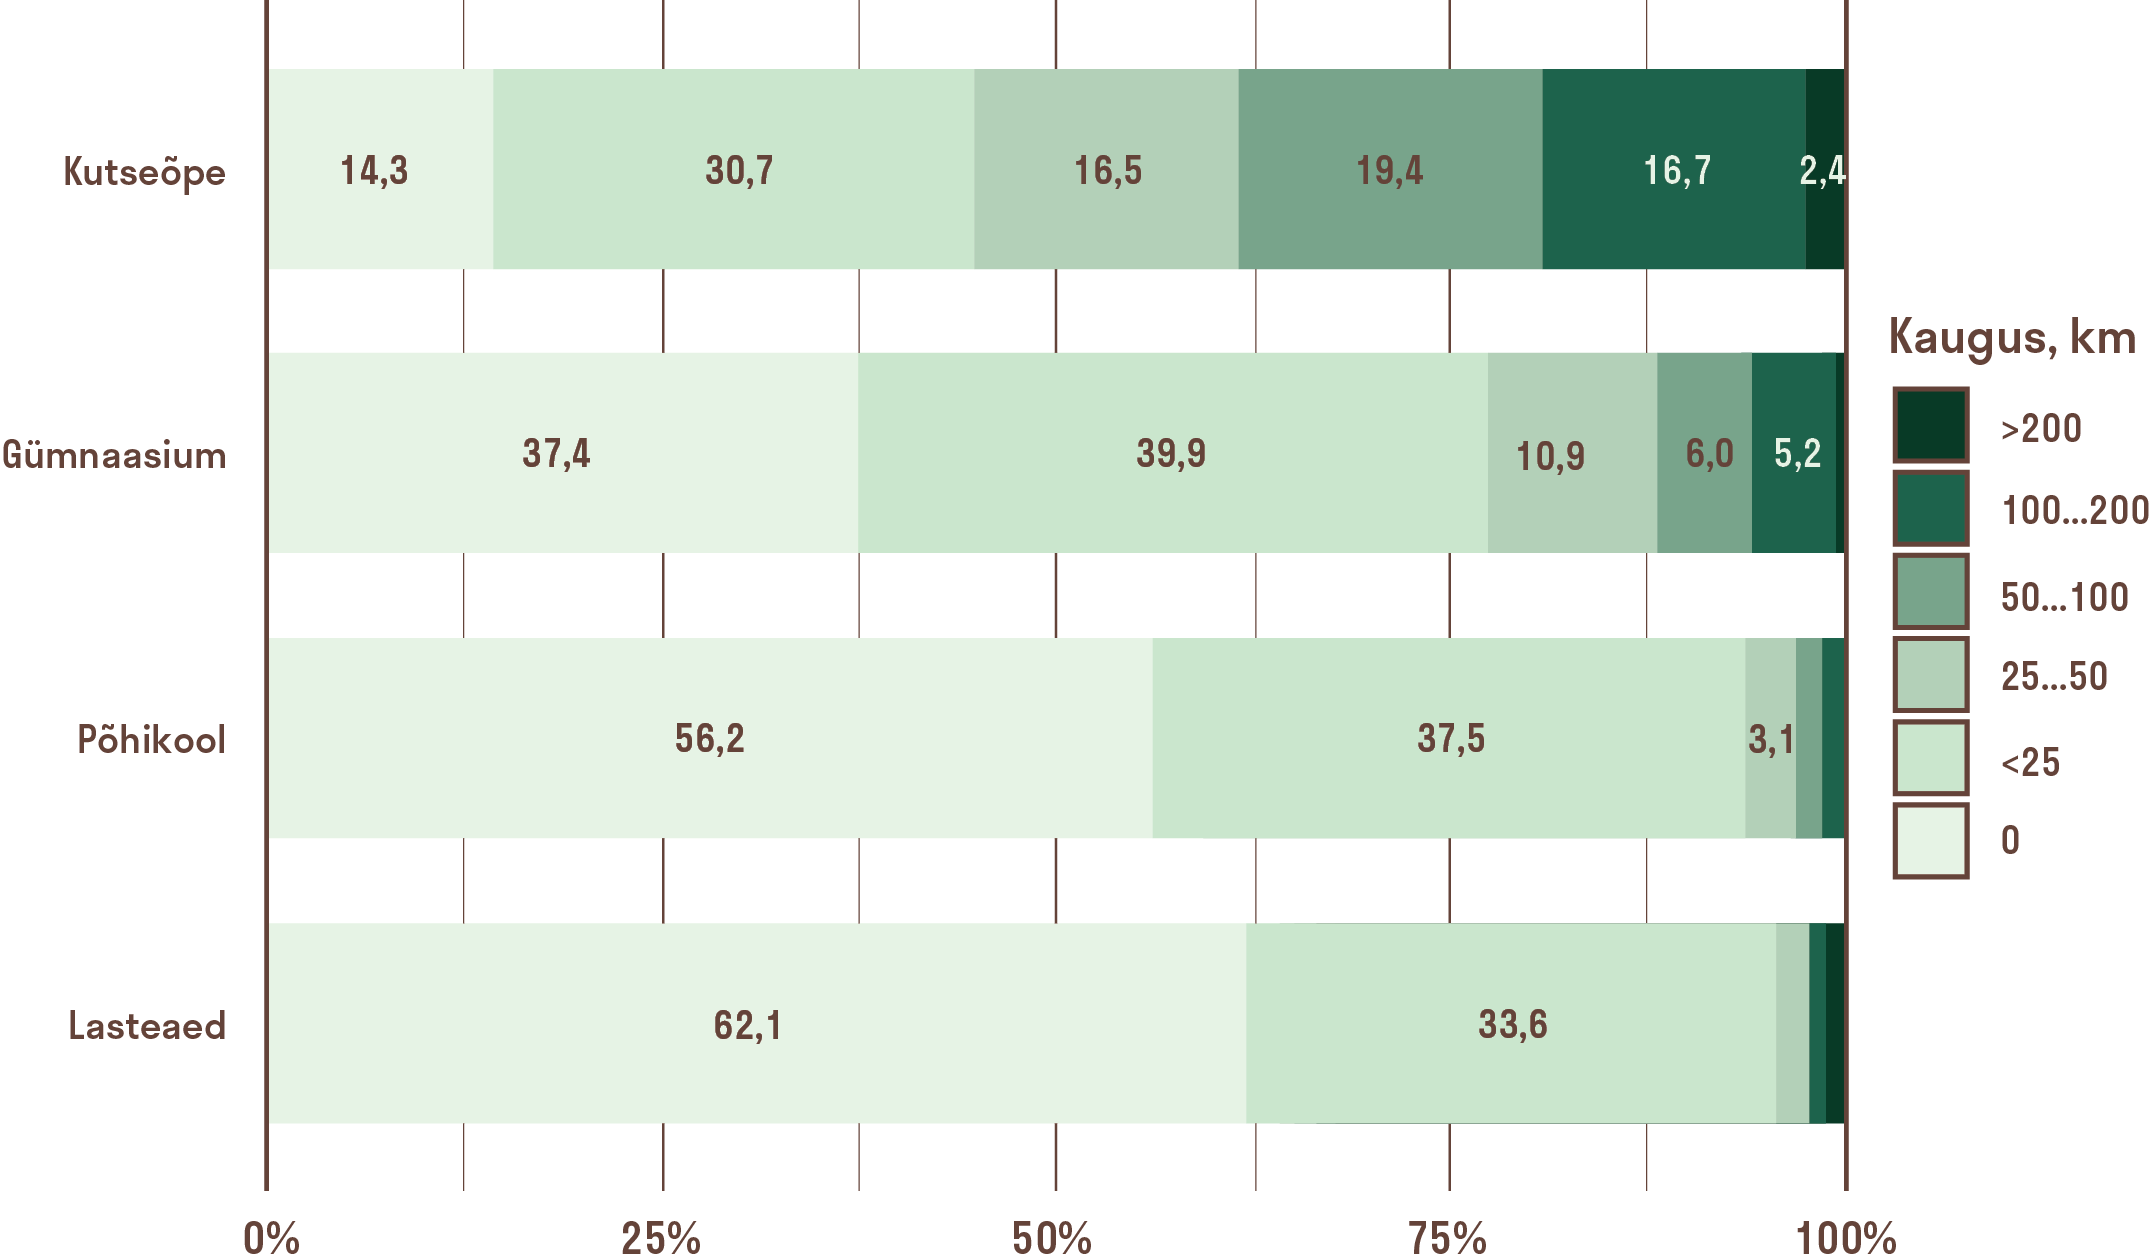
According to Statistics Estonia, in 2024 there were 66,700 children enrolled in pre-primary education, 136,200 pupils in basic education and 34,900 in upper secondary education. In addition, 23,200 pupils were enrolled in vocational education programmes based on or not requiring basic education. In total, around 261,000 pupils in Estonia commute daily for educational purposes. Overall, 51.7% of pupils – from kindergarten to the completion of upper secondary or vocational education – attend an educational institution located in the same settlement unit as their residence (Figure 6.2.2). These can broadly be described as local institutions. The share is highest among pre-primary and basic school pupils (62% and 56%, respectively). Among upper secondary pupils, the proportion studying in the same settlement unit falls to 37%, and among vocational education pupils to 14%.
A further group commute up to 25 kilometres: 34% of pre-primary children, 38% of basic school pupils, 40% of upper secondary pupils and 31% of vocational education pupils. For pre-primary and basic school pupils whose journeys substantially exceed this distance, Population Register data may not accurately reflect actual residence, or the registered school address may differ from the location where teaching takes place. The upper secondary and vocational school networks are more geographically dispersed, and commuting distances are longer, making it harder to distinguish between genuinely long journeys and potential data inconsistencies. In addition, Population Register data do not capture residence in student dormitories.
REGIONAL DIFFERENCES IN PUBLIC TRANSPORT AVAILABILITY AND SCHOOL NETWORK SEGREGATION CREATE INEQUALITIES IN SCHOOL TRAVEL
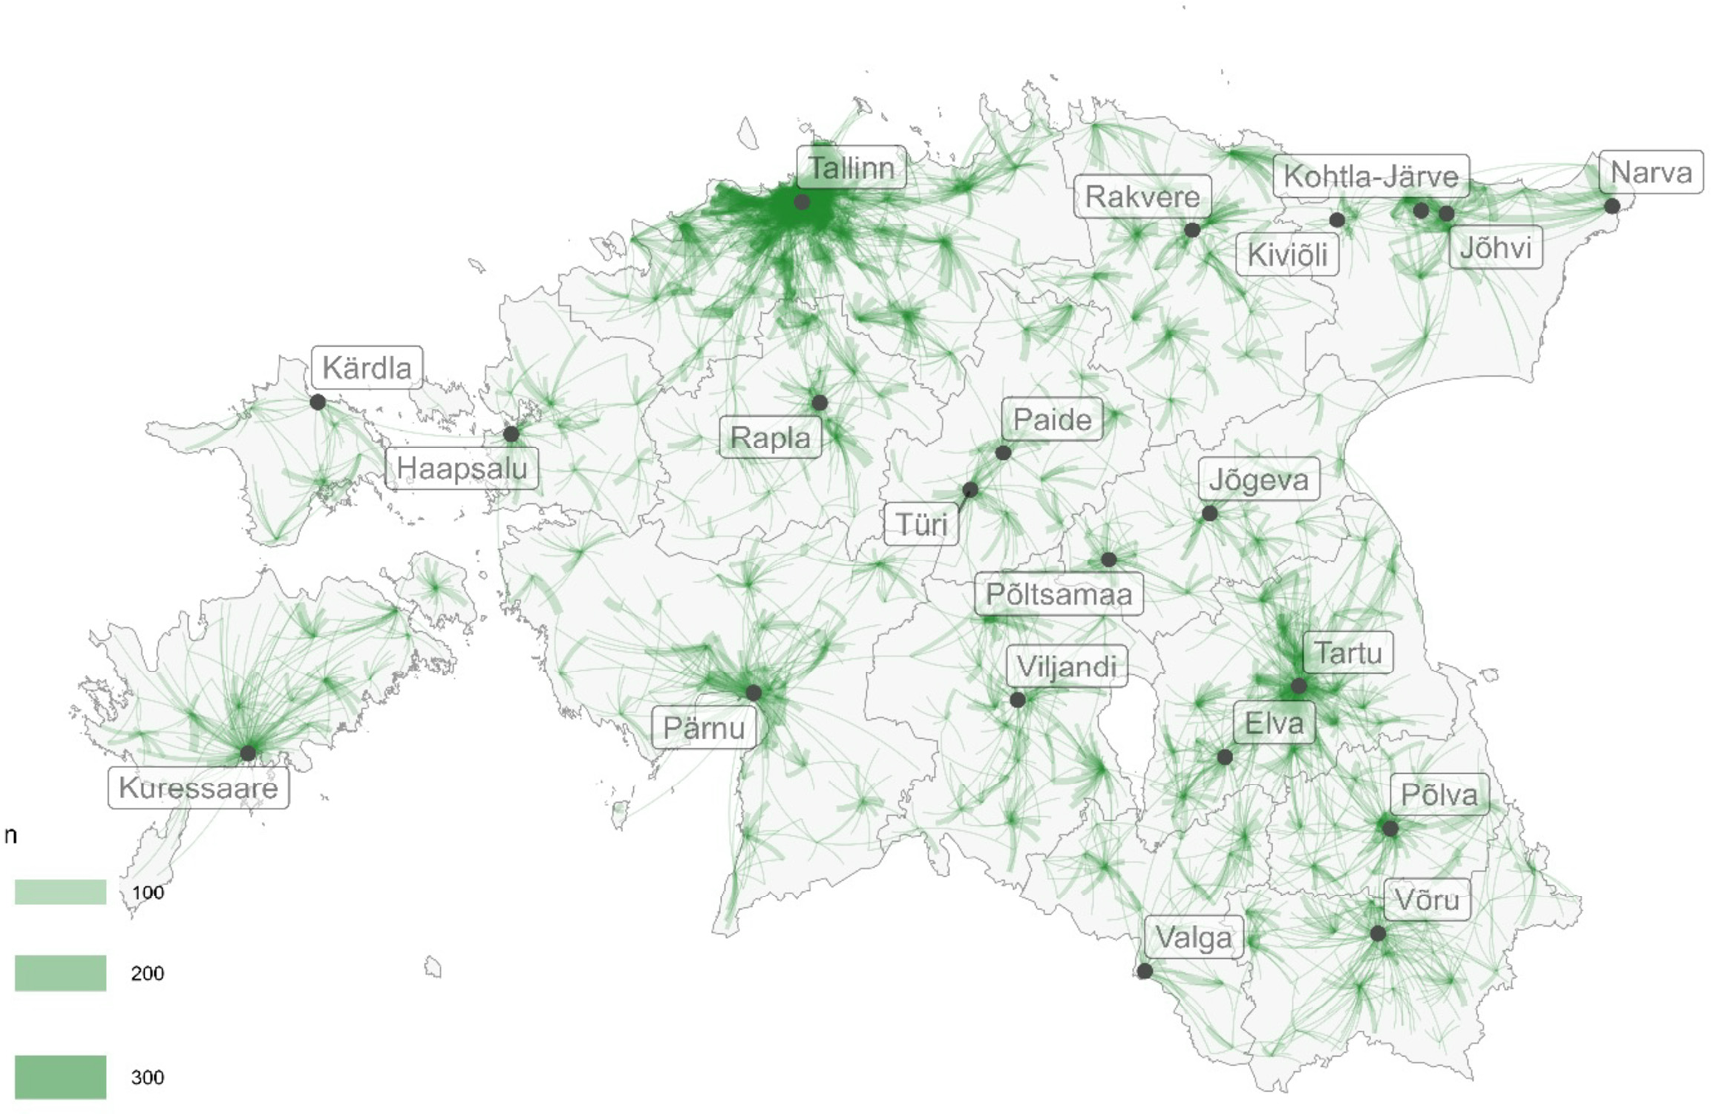
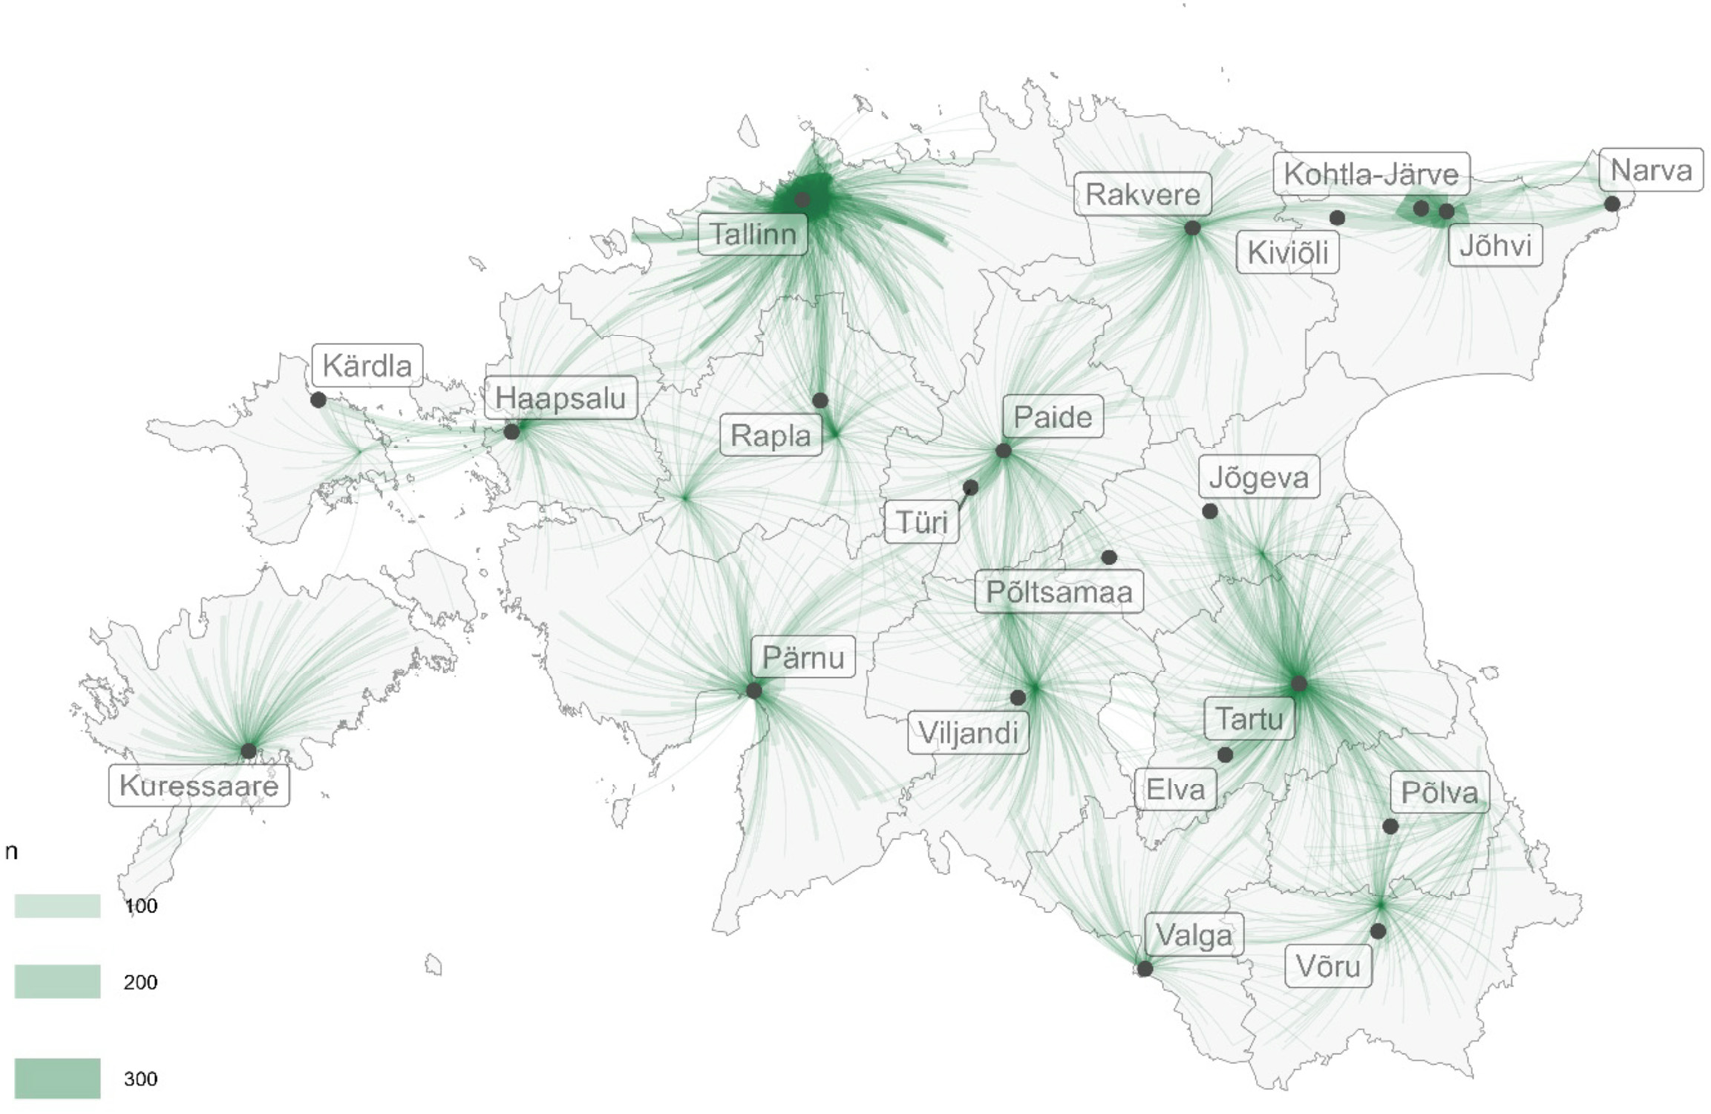
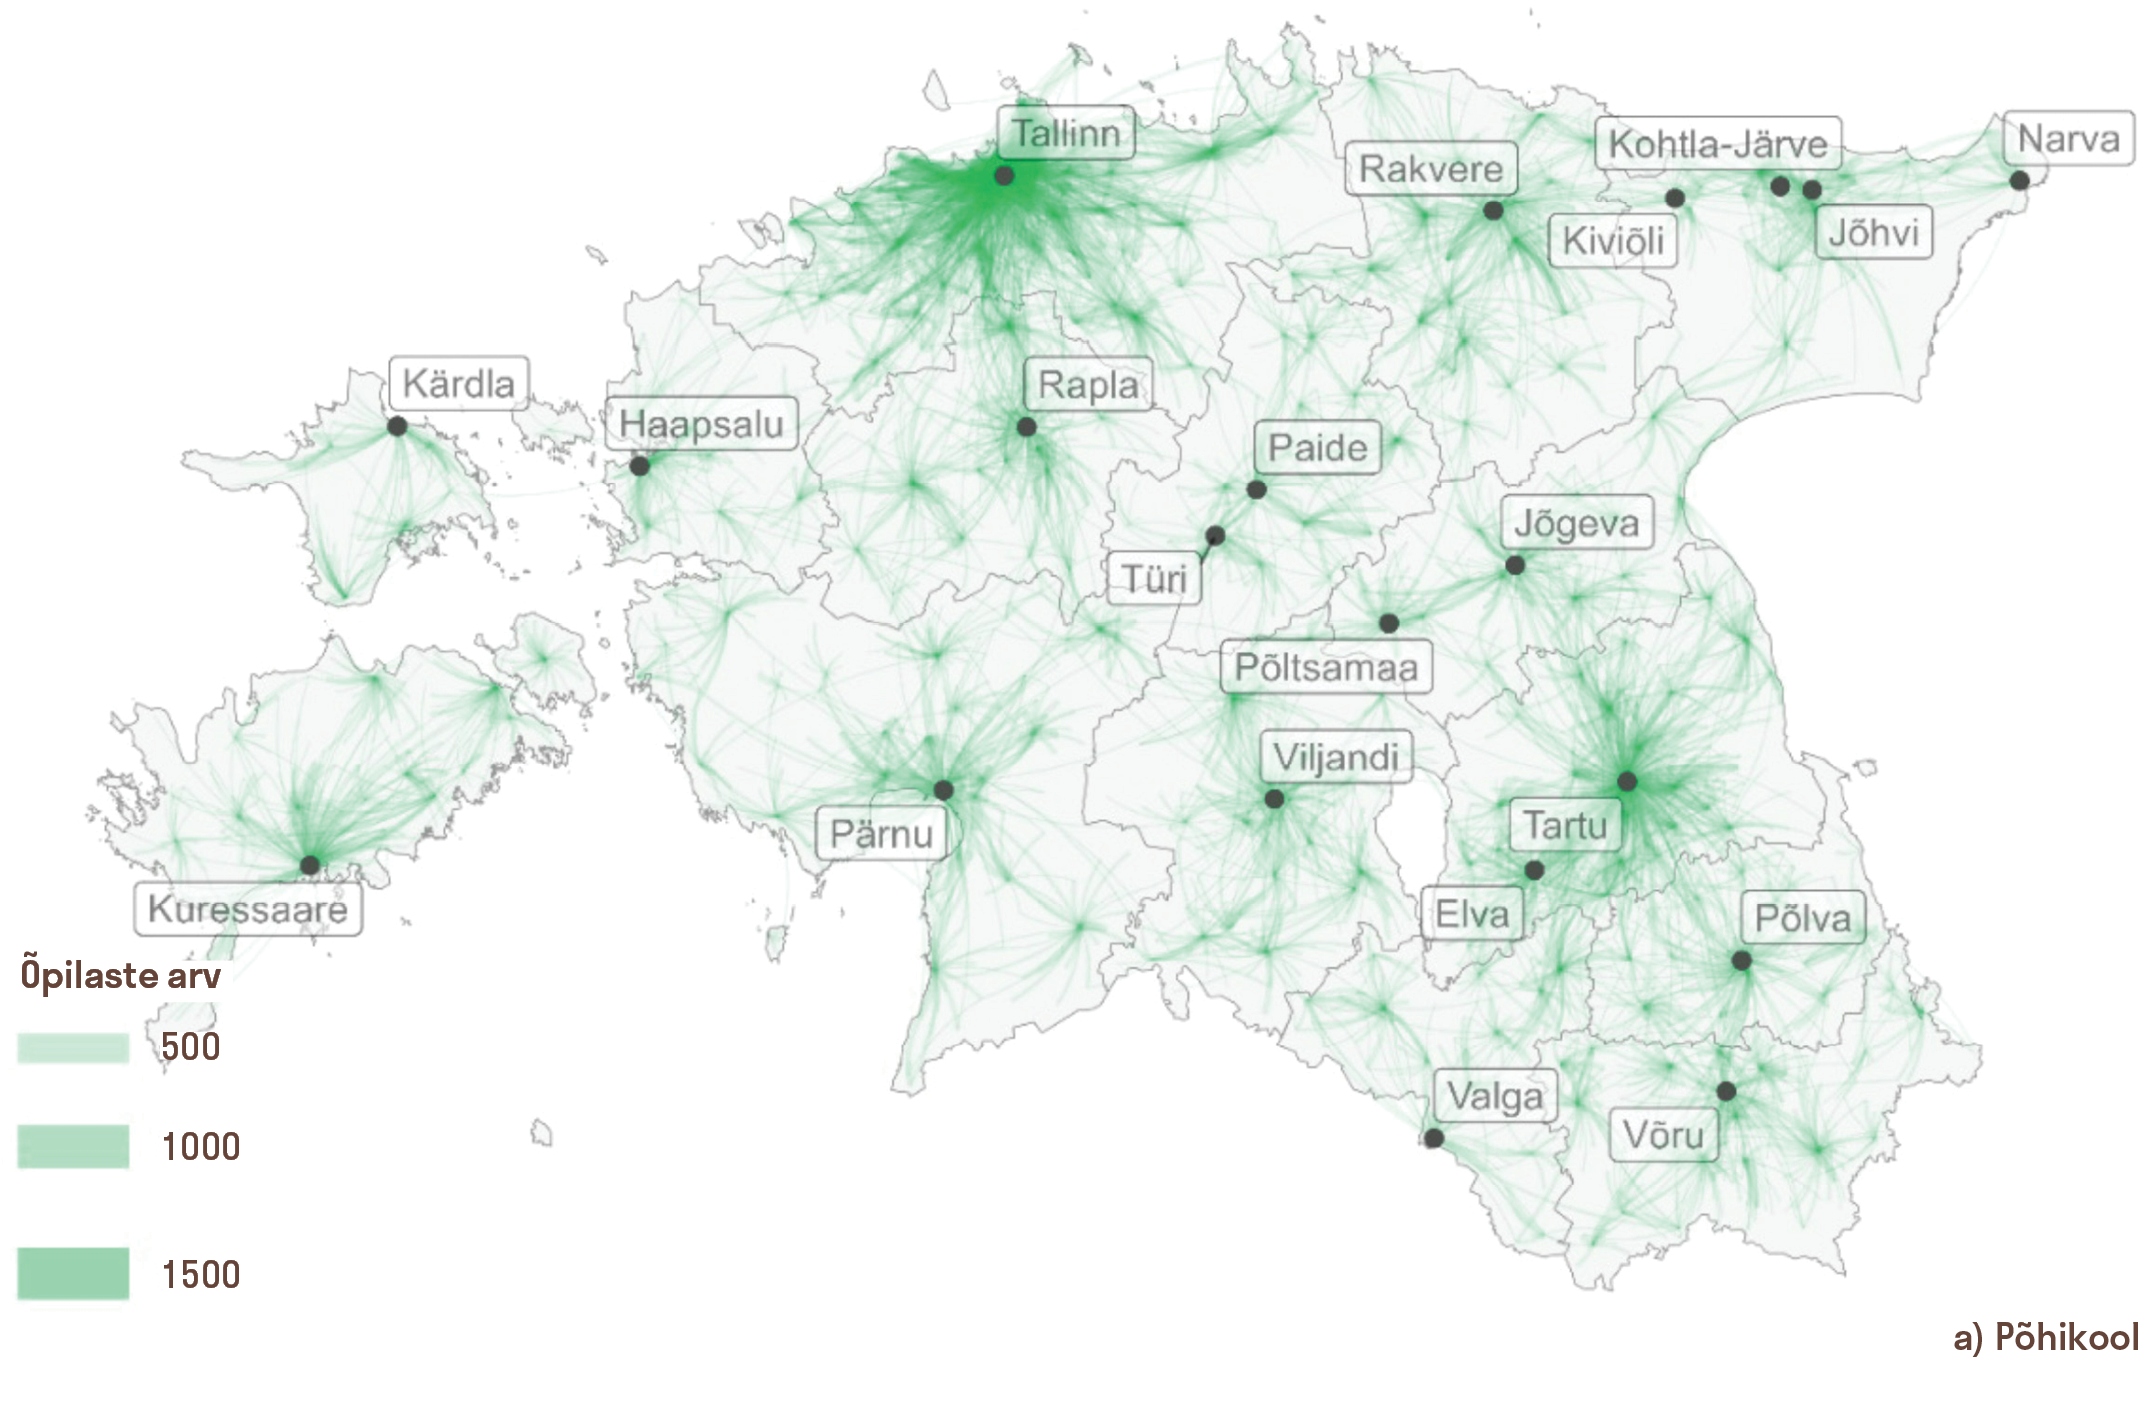
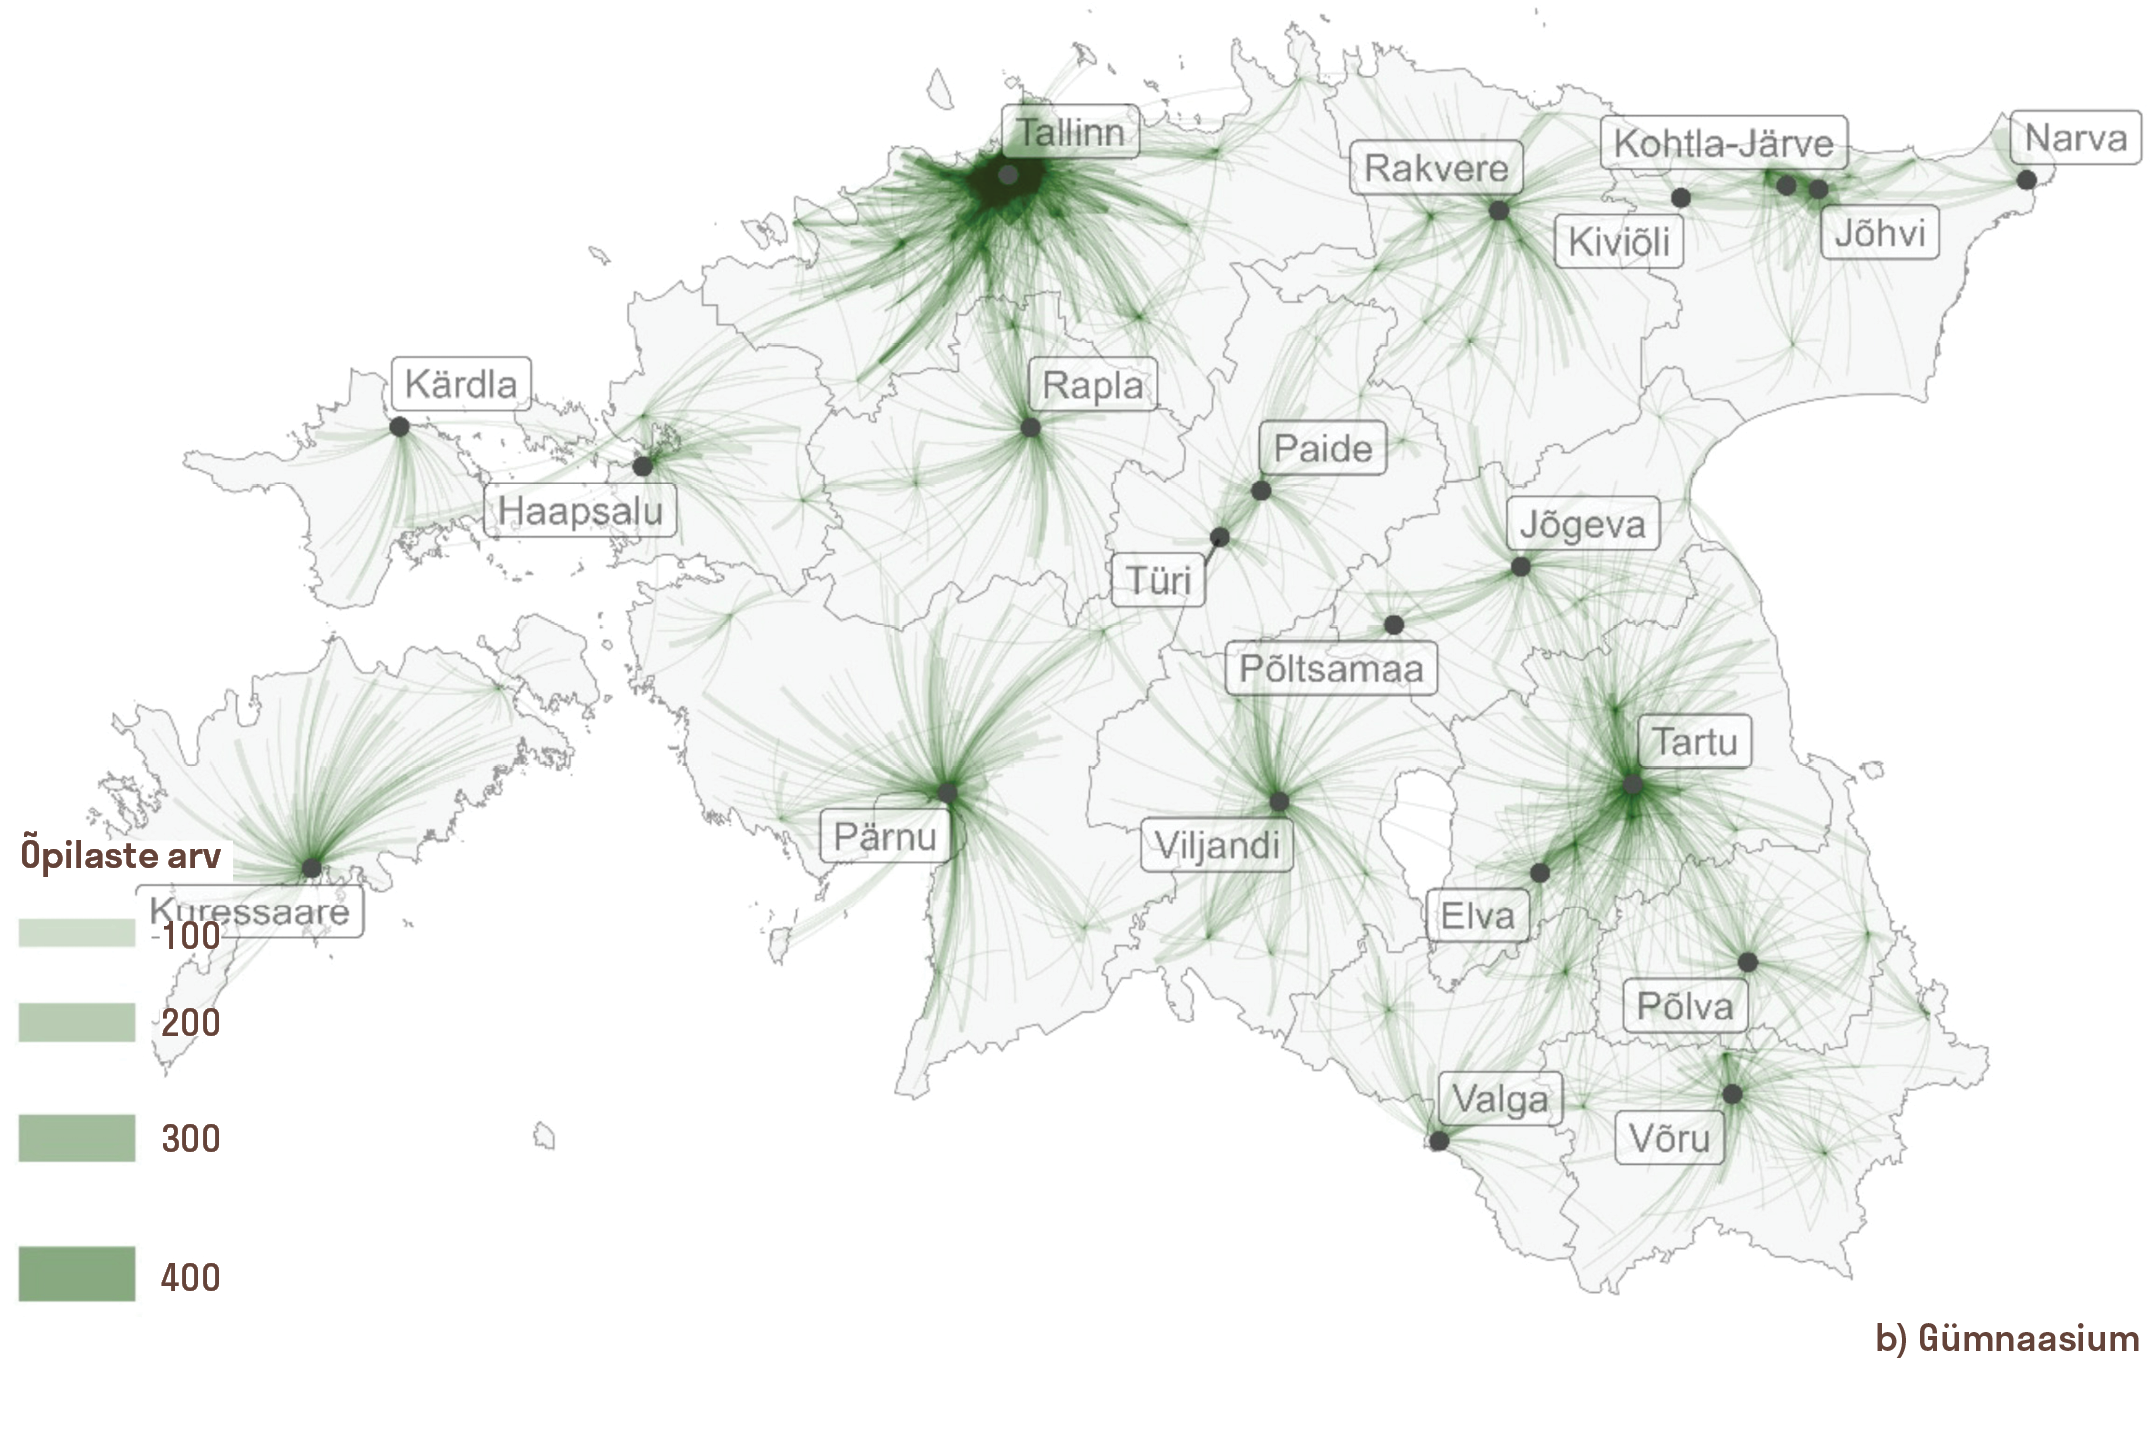
Daily school-choice-driven mobility broadly follows the logic of Estonia’s system of local commuting centres and their functional areas. Local commuting centres are towns and cities that attract commuters seeking work and services from areas with fewer employment opportunities and a more limited service base. In the case of school-choice-driven mobility, kindergartens and schools function as centres, and their spatial distribution strongly shapes the daily mobility of pupils and associated adults. Figure 6.2.3 presents the spatial pattern of commuting for basic and upper secondary education. The network of kindergartens and basic schools largely mirrors Estonia’s settlement structure and provides relatively even territorial coverage. Nonetheless, regional disparities are evident. In areas such as the larger islands, Lääne County, Pärnu County and Ida-Viru County, the network is less dense, meaning that children often travel longer distances to attend school.
The presence of a local educational institution does not guarantee that children attend it. Segregation within the Estonian education system is particularly visible in larger urban regions, where children often commute either from surrounding areas into the urban centre or from suburban districts into the city centre, even when a school is available closer to home.
Beyond major urban centres, a substantial share of school-choice-driven mobility is also directed towards smaller settlements. In vocational education, the mobility network is considerably sparser, reflecting the smaller number and more concentrated location of institutions. Unlike general education, vocational schools are typically located in the core areas of functional regions or their immediate surroundings. Notable exceptions include Sillamäe, Räpina, Vana-Vigala and Olustvere.
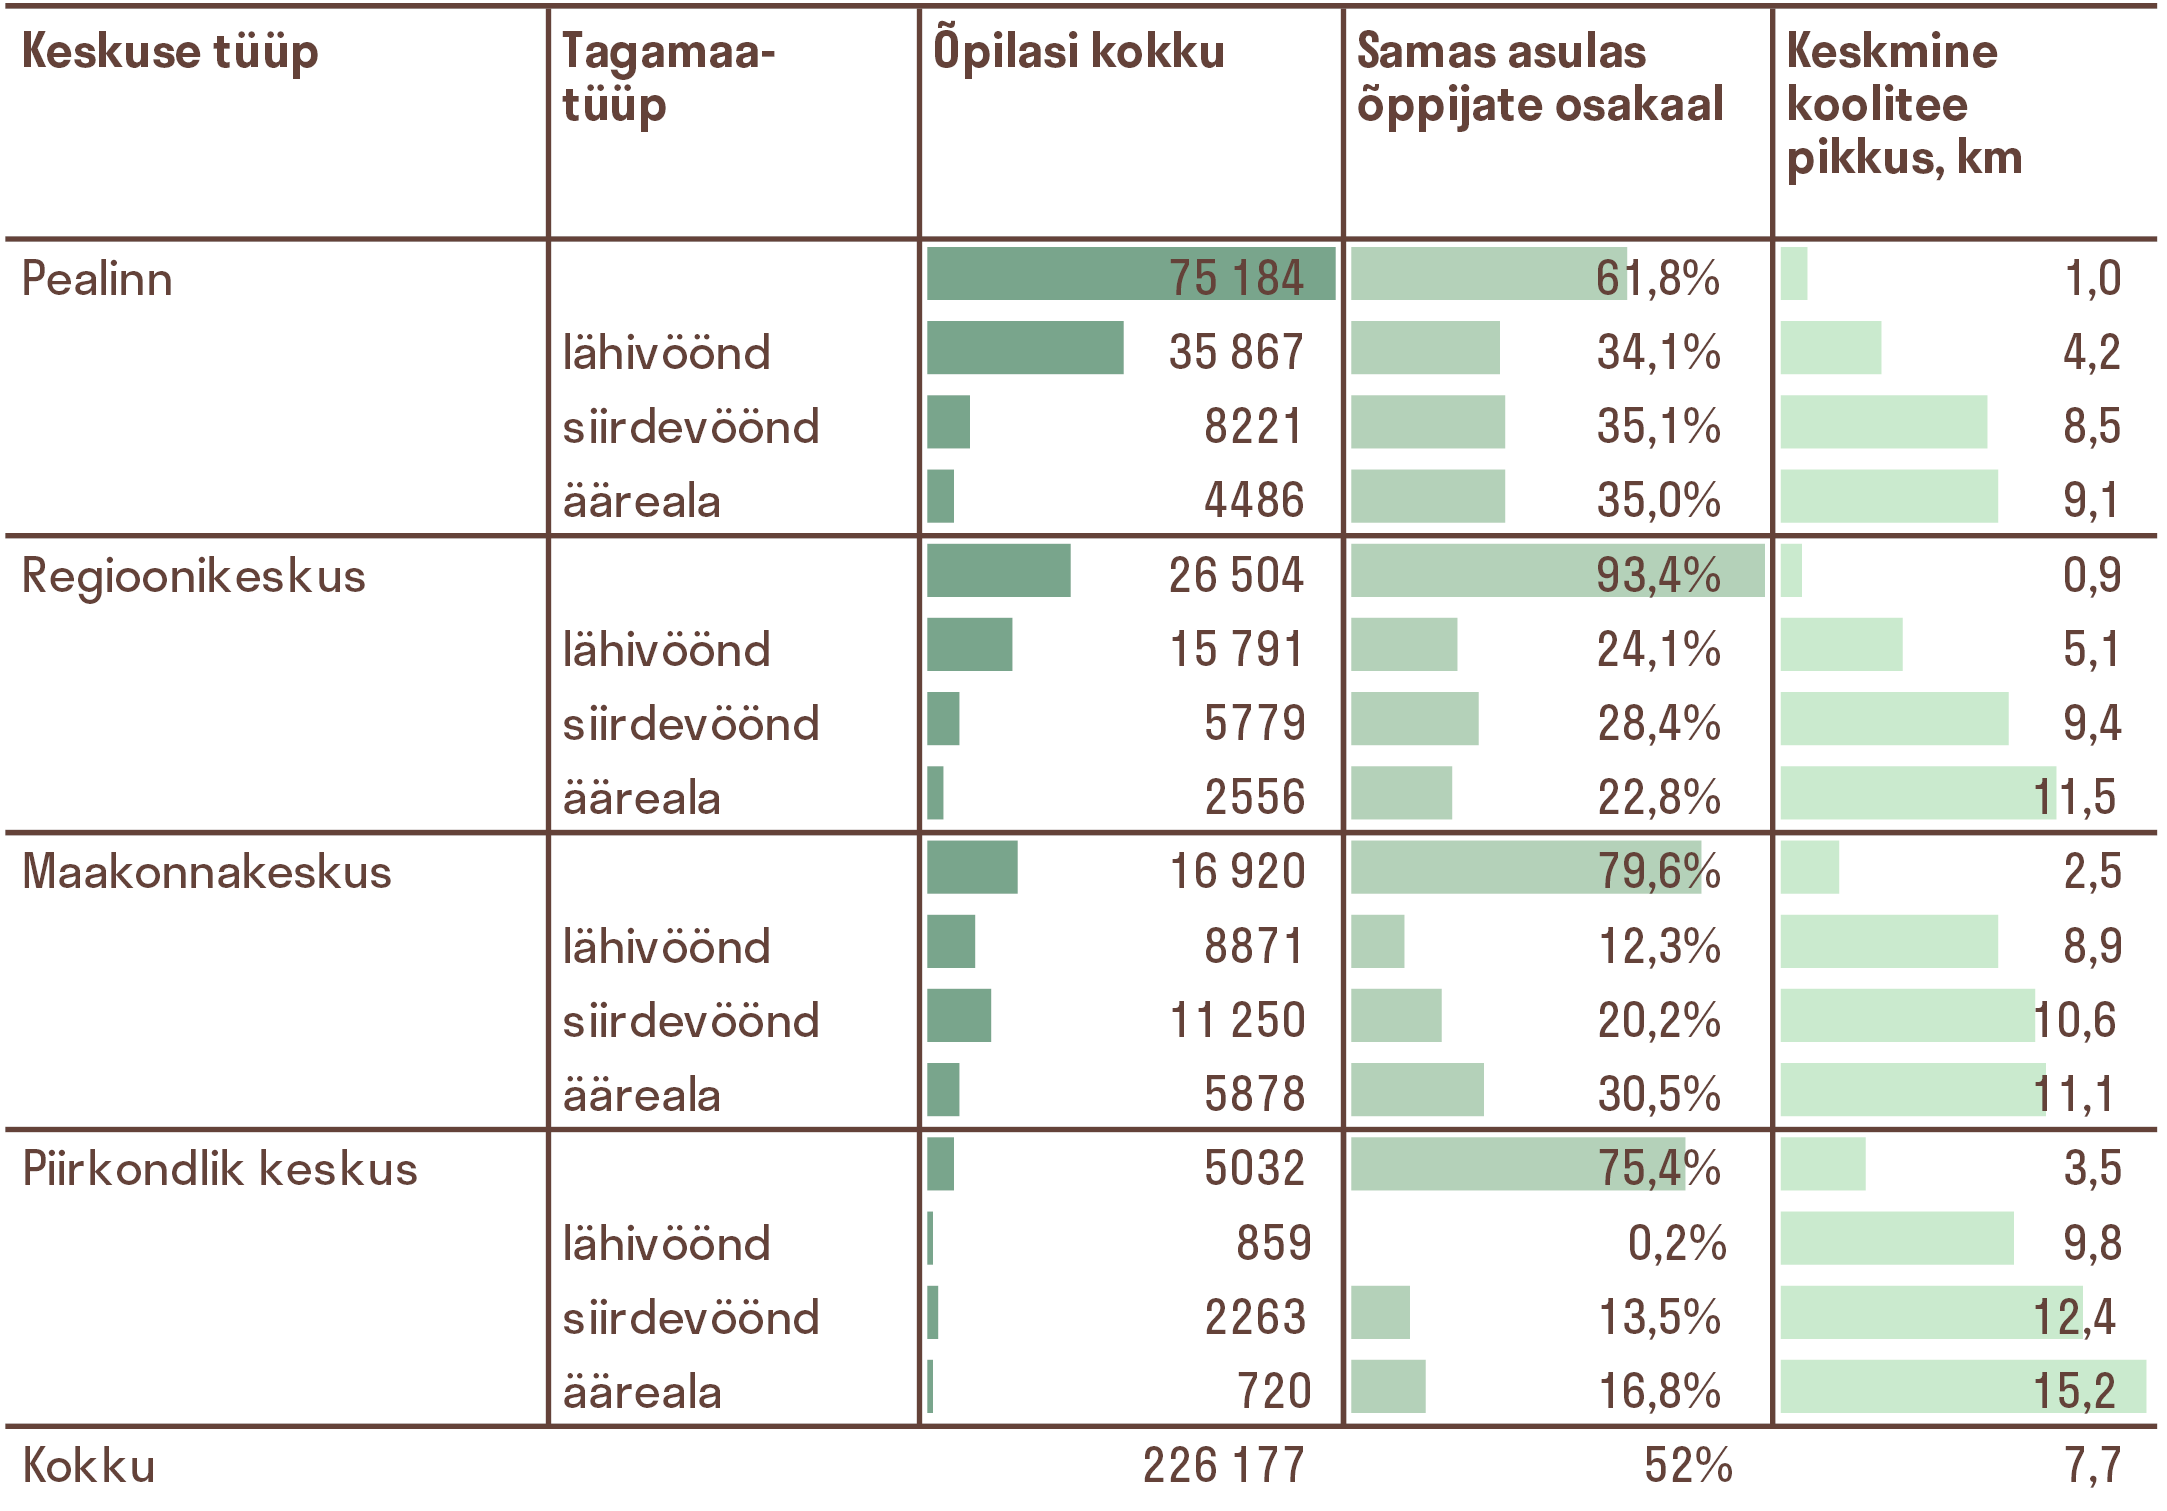
Marked differences in school-choice-driven mobility appear across urban centres and their functional areas (Table 6.2.1). The table shows the share of pupils studying in the same settlement unit as their residence and the length of the school journey, classified by place of residence in urban centres (from the capital to regional centres) or in functional area zones (see methodology box). At all levels of commuting centres, a higher share of pupils study in the same settlement unit and average school journeys are shorter than in surrounding functional areas. The highest proportion of pupils studying in the same settlement unit is found in regional centres (Tartu and Pärnu), at 93.4%. In Tallinn, 61.8% of pupils study in the same settlement unit (city district) as their residence. The lower the level of the commuting centre, the smaller the share of pupils within its functional area who study in the same settlement unit as their home. This reflects the density of the school network, which is greatest in the capital region and more limited in the functional areas of regional, county and local centres. It is also evident in commuting distances: average home-to-school distances are shortest in the capital region and longest among pupils living in the functional areas of local centres. Within each functional area, the average journey length increases from the centre towards the periphery. These patterns directly shape pupils’ opportunities for independent mobility and active school travel within Estonia’s school network.
MANY PUPILS TRAVEL TO SCHOOL BY CAR, BUT BETTER AVAILABILITY AND WIDER ACCEPTANCE OF PUBLIC TRANSPORT WOULD SUPPORT INDEPENDENT SCHOOL TRAVEL
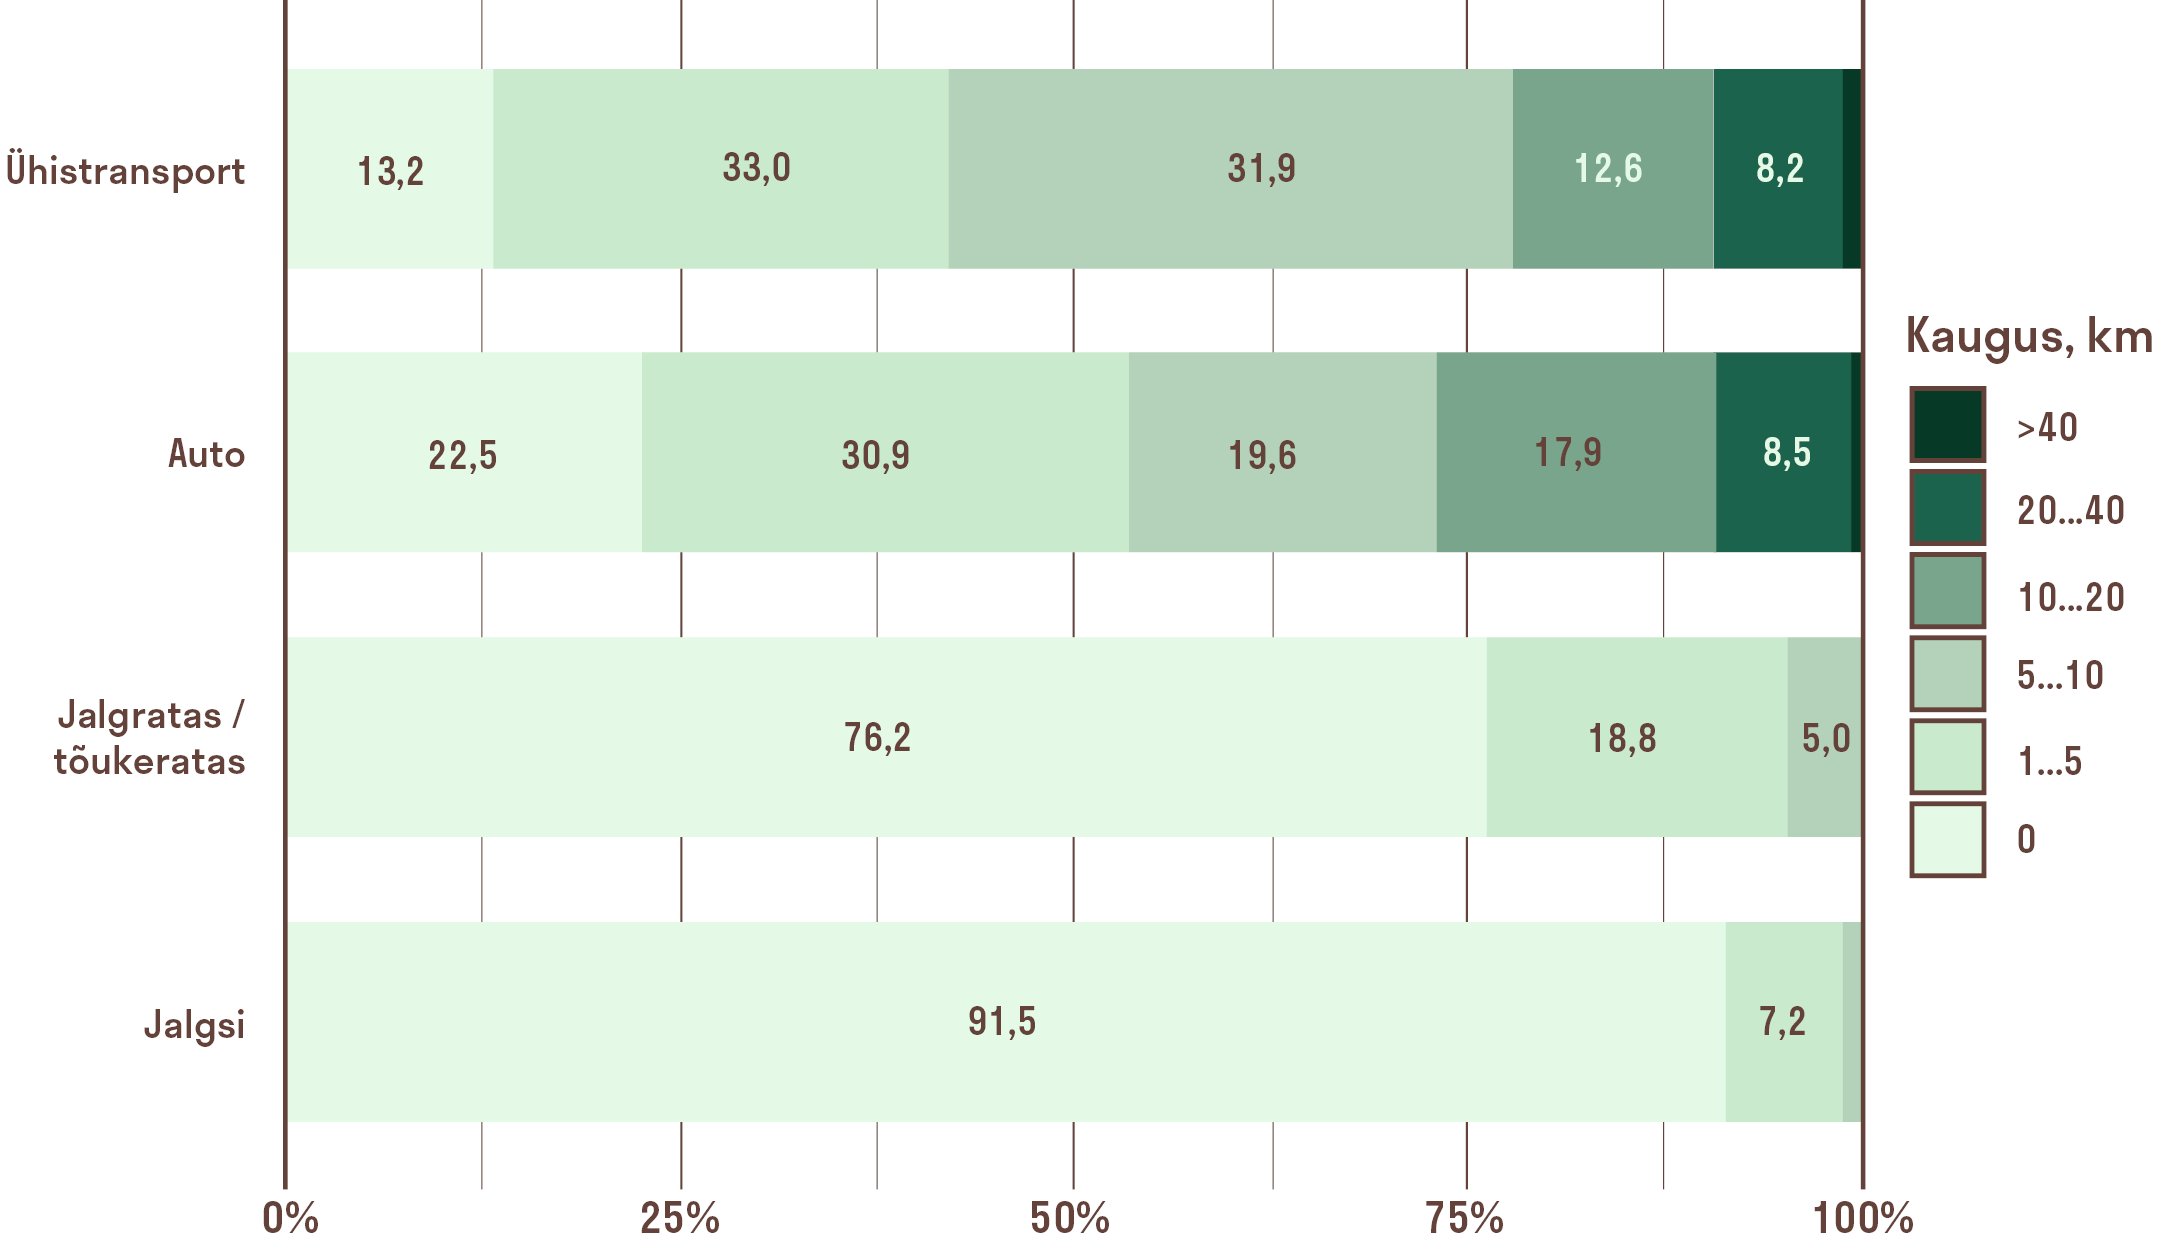
According to the 2021 Estonian Residents’ Mobility Survey, 43% of pupils’ school-choice-driven journeys were made by car, 30% on foot, 19% by public transport, and 8% by bicycle or scooter. In 52% of cases, travel took place within the same settlement unit. Figure 6.2.4 shows the distribution of journey distances by mode of transport. Walking and cycling were largely confined to journeys within the same settlement unit, but around half of school journeys made by car or public transport were also five kilometres or less.
Short car journeys offer the greatest potential to increase independent and active school travel by shifting to more sustainable modes. Over longer distances, public transport is often the only realistic alternative to the car. The survey shows that car use is more than twice as common as public transport use. However, it remains unclear to what extent public transport meets pupils’ daily mobility needs, whether car use reflects preference or necessity, and to what degree residential choices consider children’s opportunities for independent school travel.
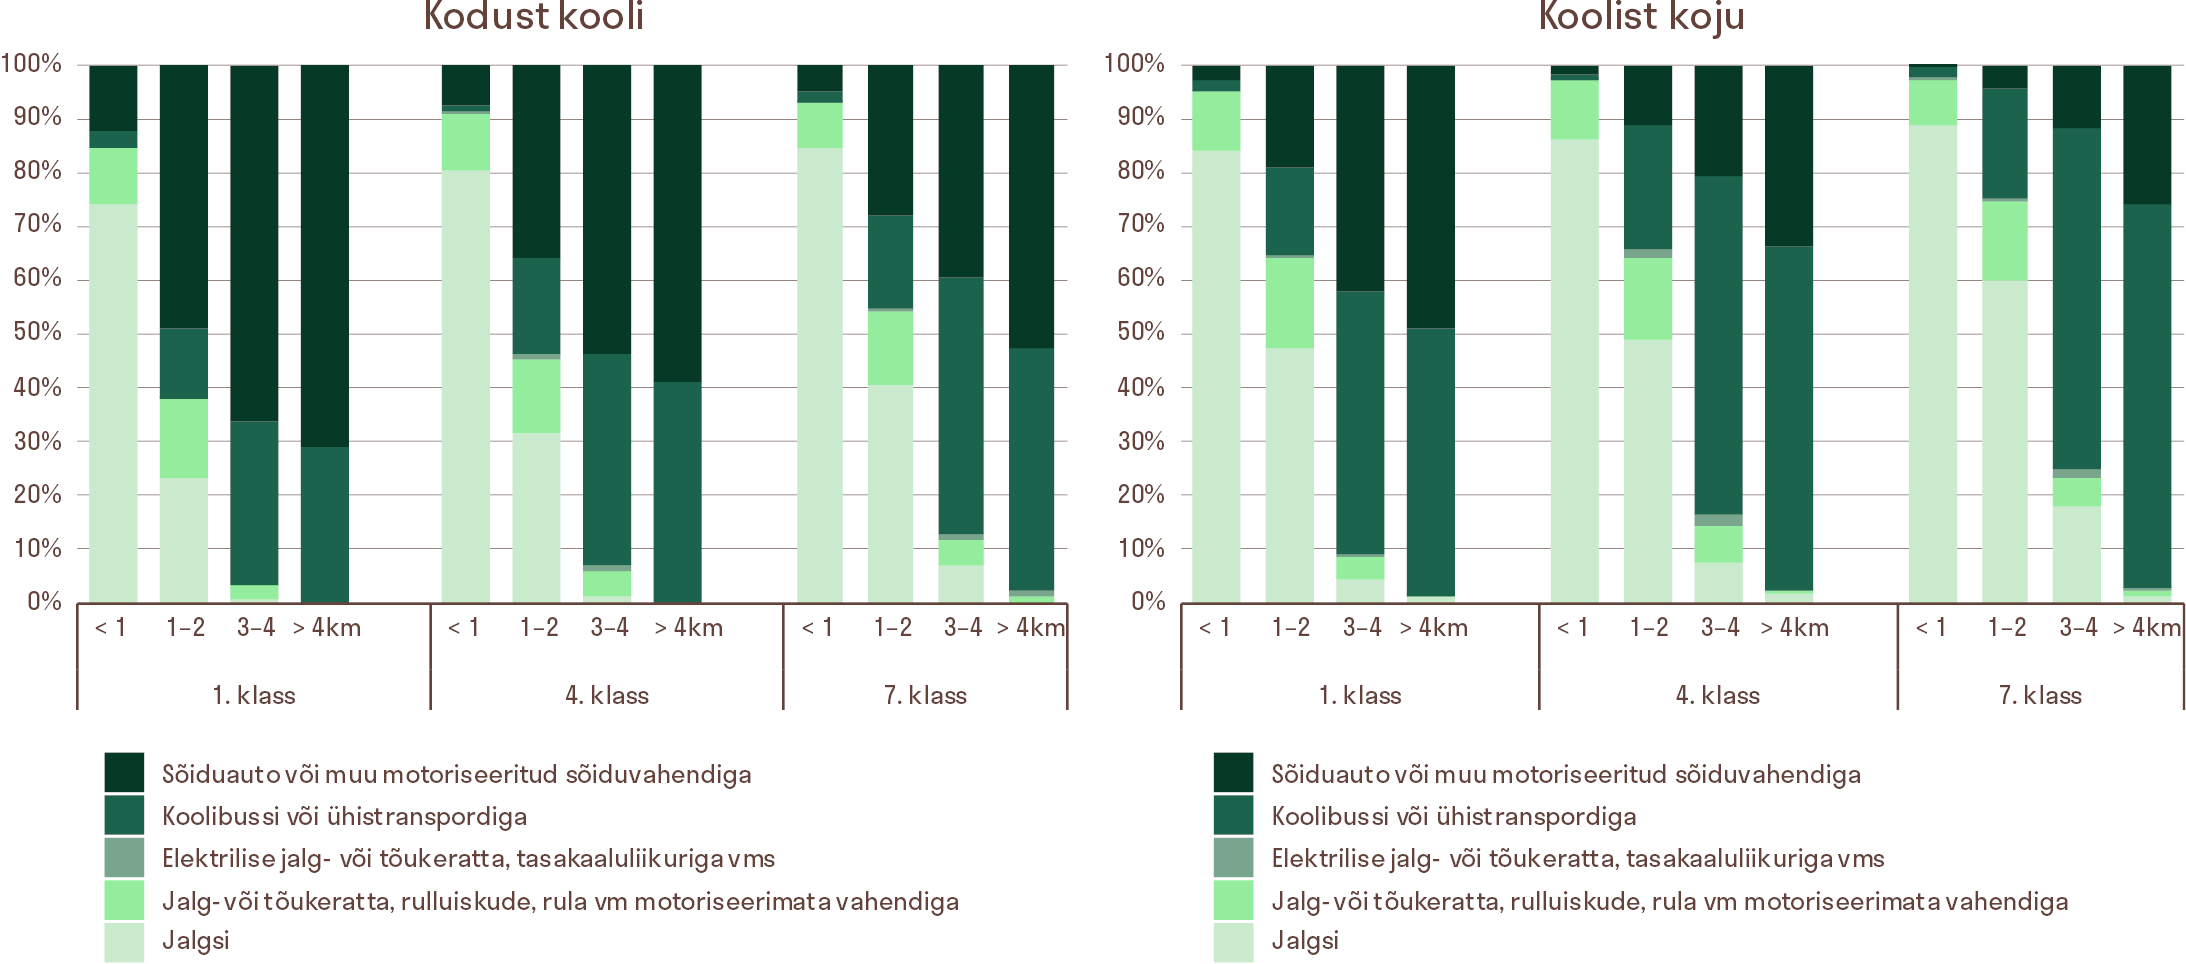
Further insight comes from the 2022 Estonian Student Growth Study.31 Pupils generally walk or cycle to school when the distance is up to two kilometres, while longer journeys are made by car or public transport (Figure 6.2.5). Older pupils are less likely to be driven than younger ones. Car use is substantial on the journey to school – around 45% in Grade 1 and 30–35% in higher grades – but considerably lower on the return journey (25% in Grade 1 and 10–15% in higher grades). Morning trips are often combined with parents’ commuting or other family travel, whereas after school about 20% of children who were driven in the morning return home independently. This indicates that alternatives and opportunities for independent mobility are available.
Among pupils who travel by motor vehicle, around 60% across the surveyed grades cite distance as the main reason.32 The second most frequently cited reason is logistical fit with other family members’ schedules and needs (34–43%), while comfort ranks third (around 25%). Expanding the availability and attractiveness of public transport could therefore reduce car use, support independent mobility and increase the uptake of sustainable modes. For this to happen, routes and timetables must enable independent school travel. The need for improvement is evident: for about 15% of pupils, travelling by school bus or public transport takes an unreasonably long time, and a similar share rely on a car to attend after-school activities. Daily car use in school-choice-driven mobility has significant environmental, climate and health consequences, both now and in the future, as mobility habits formed in childhood often persist into adulthood.
BETTER EDUCATION, RESIDENCE AND MOBILITY DATA ARE NEEDED TO ANALYSE LINKS WITH SUSTAINABLE MOBILITY
Understanding pupils’ actual mobility needs and habits requires more precise and accessible data. Current education, residence and mobility datasets do not provide a comprehensive picture. Pupils’ mobility appears only in a few surveys conducted intermittently, which do not distinguish between seasons and lack detailed spatial information. Data collection practices can also distort findings. Registers do not differentiate between schools operating at multiple locations, vocational education data combine pupils enrolled on the basis of basic and upper secondary education, and the Population Register does not record the temporary addresses of pupils living in dormitories or rented accommodation. Among vocational education pupils, and increasingly among upper secondary pupils, living near the school during studies is common. Until adulthood, however, a child’s official residence remains that of their parent or parents.
In summary, nearly half of Estonian pupils attend an educational institution in a different settlement unit from their place of residence. This pattern becomes more pronounced at higher levels of education. School choice is shaped not only by residence within Estonia’s settlement structure and the availability of a local school but also by family preferences and segregation within the school network. Attending a local school increases the likelihood of independent and active travel, whereas segregation contributes to longer journeys and fewer opportunities to use sustainable modes. A substantial share of pupils are driven to school, citing distance, convenience and compatibility with family schedules. Public transport could strengthen independent mobility, and where local schools are available, active school travel should be promoted more consistently. Such habits benefit health and the environment, reduce traffic impacts, and shape mobility behaviour in adulthood.
APPENDIX