PISA blindness: Why is Estonia not using the full potential of its register data?
- Educational inequality in Estonia has the face of a child who studies in an under-resourced school and comes from a disadvantaged socioeconomic background. School environments vary widely – some lack teachers, support specialists and learning materials, while others are comparatively well resourced. This raises the question of whether shortages at school are increasingly pushing parents to compensate for these shortcomings with their own resources.
- Tallinn is the region where educational stratification is deepening most rapidly. In the capital, the association between pupils’ mathematics results and the average income of their parents has consistently been nearly twice as strong as elsewhere in Estonia.
- Although Estonia is known as an e-state, digital development has not been evenly reflected in the education sector. Register data – whose use has been constrained by limited awareness and increasingly stringent data protection requirements – could already some time ago have shown that educational inequality was deepening. By contrast, PISA’s socioeconomic status indicator, which rests on a weak scientific foundation, tends to soften or distort the actual picture.
INTRODUCTION
According to the OECD definition, educational equity does not mean that all pupils achieve the same outcomes, but that their success should not depend on factors beyond their control, such as socioeconomic background.1 The influence of social background on learning outcomes varies by age, gender and subject: it tends to be stronger where the impact of school is weaker – for example, in reading – whereas school quality plays a greater role in subjects such as mathematics and science. The deepening of educational inequality in Estonia calls for decisive action to improve the quality of schools that are in a weaker position. Data-driven education analytics have significant – yet largely underused – potential to support such efforts.
CRITIQUE OF PISA’S socioECONOMIC STATUS INDICATOR
Until now, Estonia has relied on the PISA assessment to evaluate educational inequality. However, the 2022 results, which indicated increasing stratification – with 13% of the variance in mathematics performance explained by pupils’ home background – raise the question of whether educational inequality in Estonia has genuinely intensified in recent years, or whether the change reflects differences in measurement rather than a new development.2 It should be noted that PISA’s background indicator has changed over time, most notably in the 2022 cycle, and direct comparisons with earlier results are not always appropriate, even though they are often made. We wish to emphasise that this article examines only the adequacy of PISA’s socioeconomic background indicator and does not in any way question the quality of PISA’s academic assessments.
International research cautions against drawing overly far-reaching conclusions from PISA’s background indicator. It cannot therefore be claimed that pupils’ socioeconomic background has begun to influence results only recently. In the academic literature, uncritical reliance on prestige and titles is described as prestige bias.3 We tend to place greater trust in individuals and institutions that have already achieved success or recognition in a particular field. This so-called fast track of trust operates especially quickly in the case of international rankings such as PISA. However, the reliability of a study depends not on institutional authority, but above all on methodological rigour and relevance. Unfortunately, PISA’s high prestige has overshadowed a more thorough examination of internal inequalities in Estonia.4
In the academic literature, the so-called golden trio for measuring educational inequality consists of parental income, occupation and education. In PISA, pupils’ home background is measured using the index of economic, social and cultural status (ESCS), which combines social, economic and cultural factors into a single composite indicator. Researchers have argued that the ESCS lacks a clear scientific foundation: while it includes parental education and occupation from the classical socioeconomic trio, it substitutes family income with household possessions as a proxy.5 The core problem of PISA’s socioeconomic background indicator lies in how the data are collected. The measure is based on pupil questionnaires, and evidence from Germany suggests that children from poorer families are more likely not to respond.6 We therefore examine in more detail the limitations of the three components used by PISA to assess pupils’ socioeconomic background.
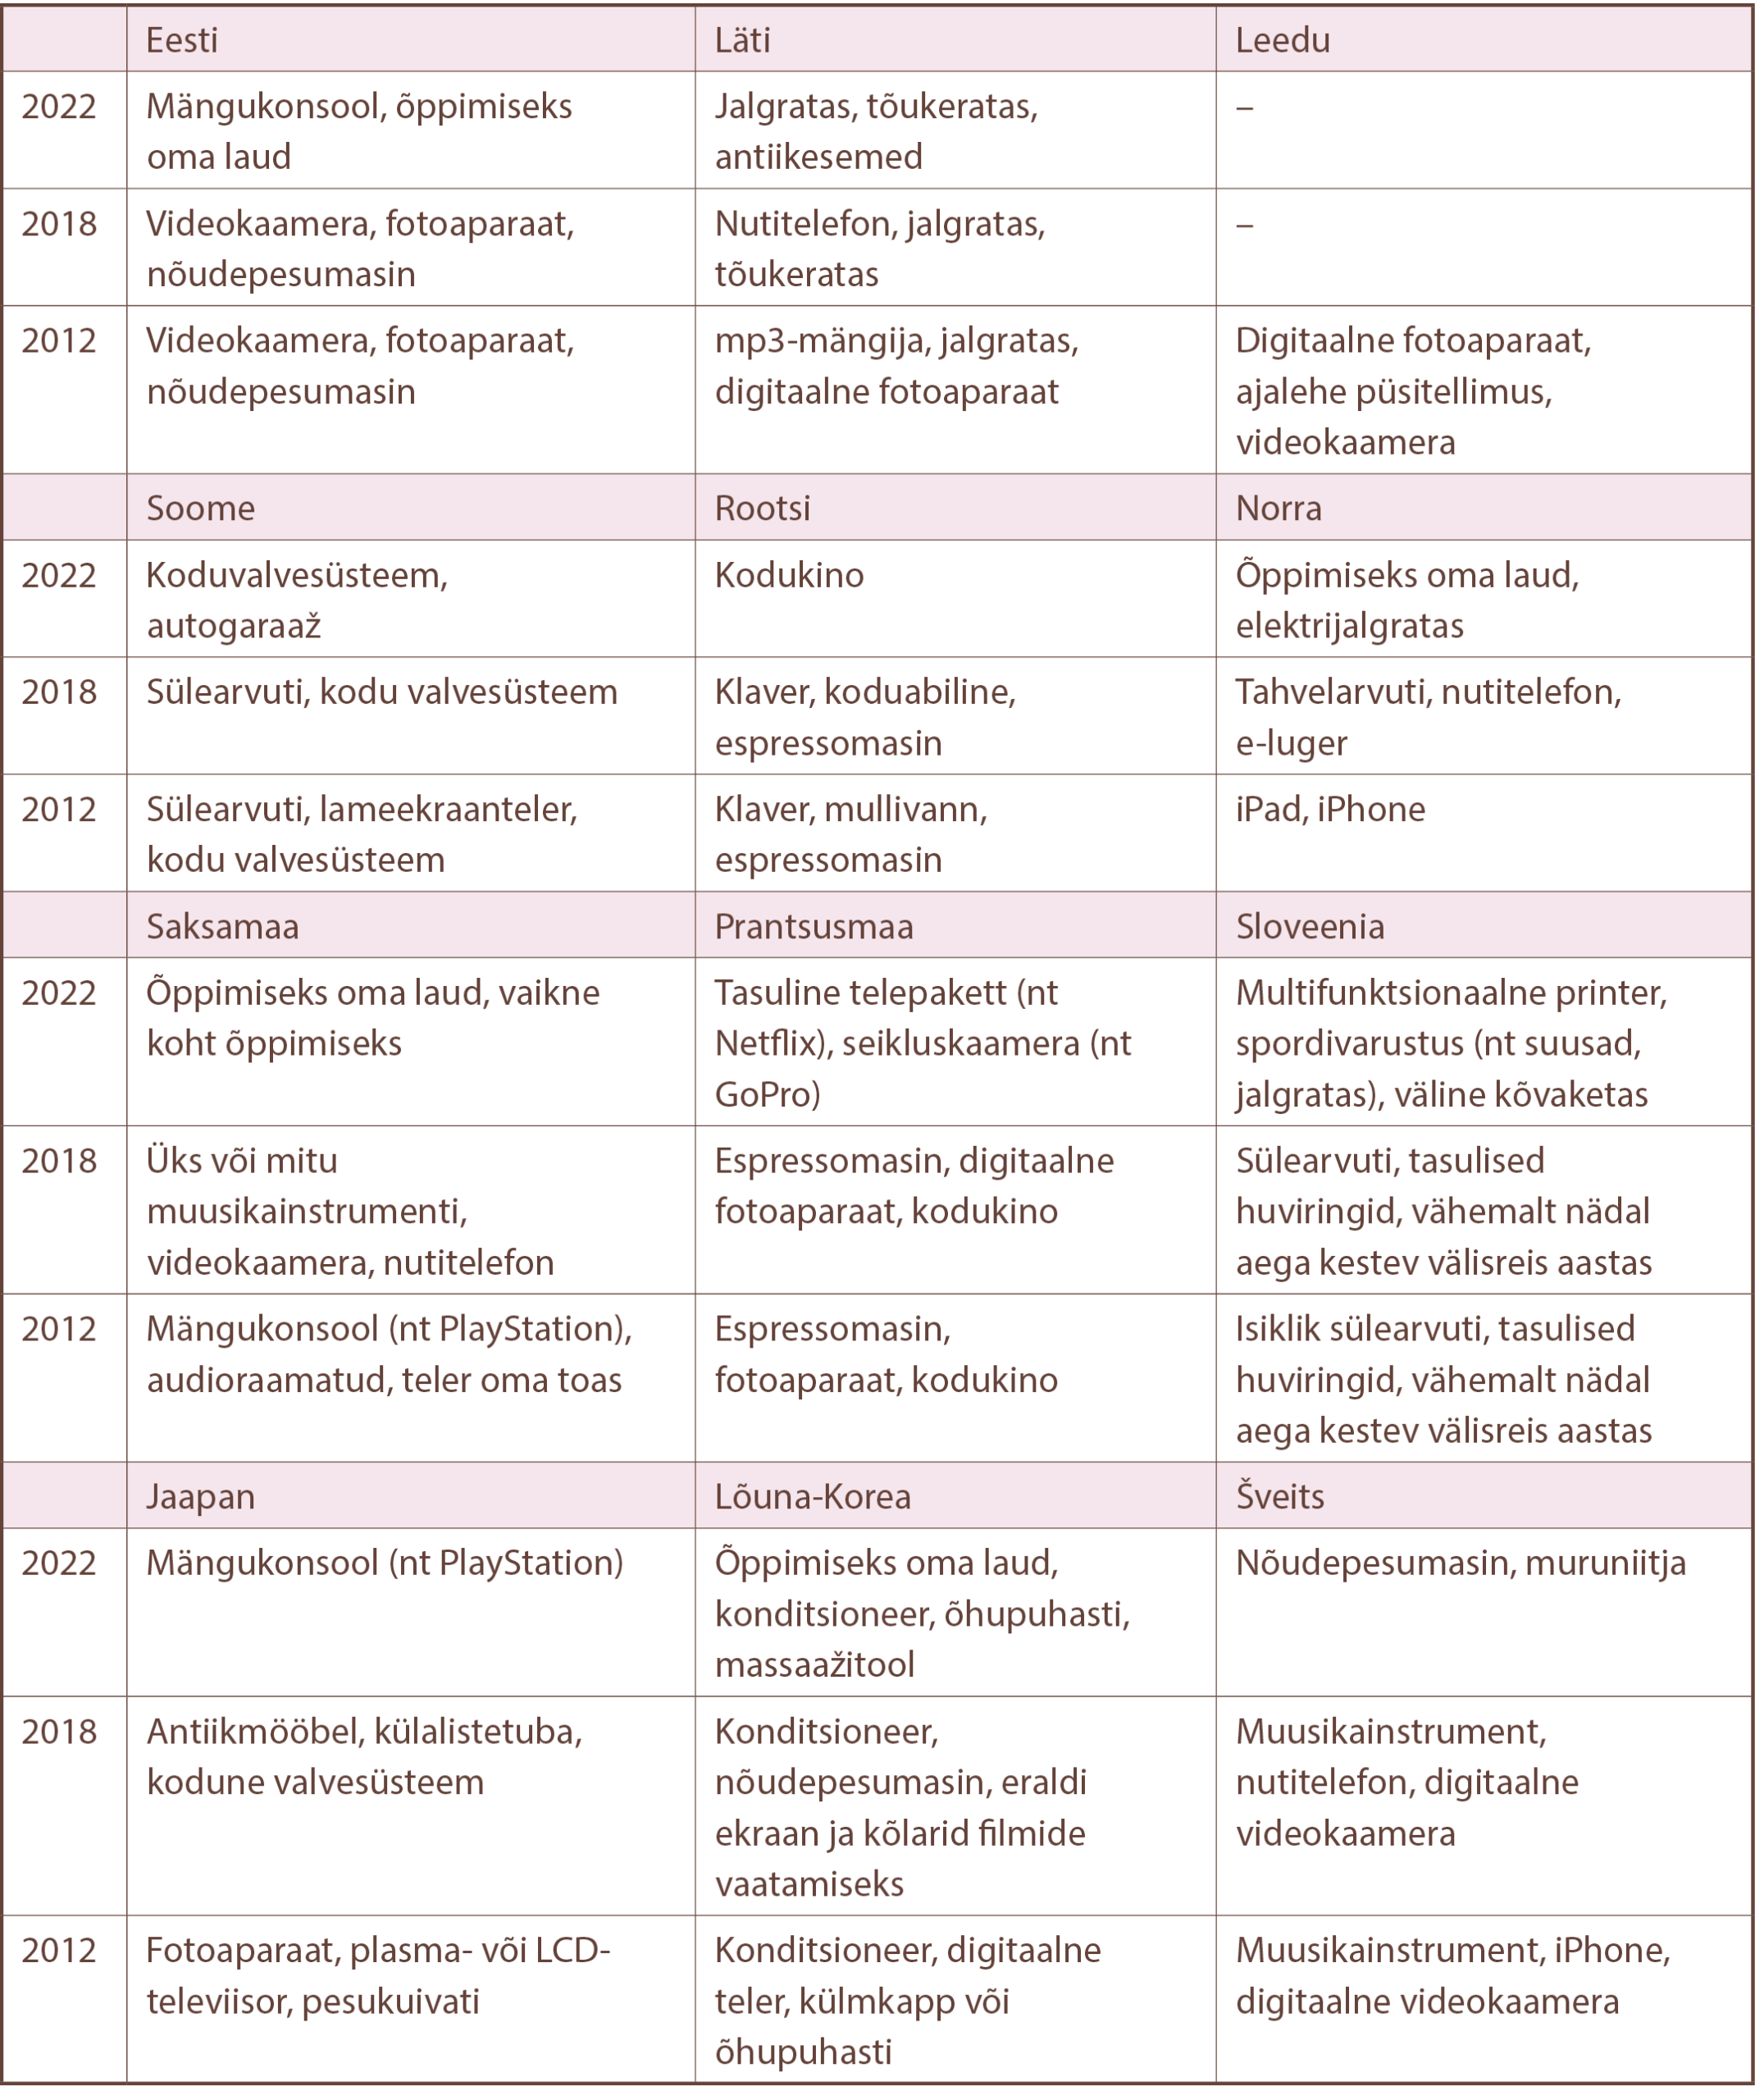
The economic component, ‘home possessions and resources’, measures material well-being on the basis of consumption patterns – specifically, items available in the homes of 15-year-olds.7 Pupils indicate whether certain items are present at home, such as a desk for studying or their own room. The index also includes three country-specific items (see Table 2.2.1) that PISA considers indicative of family wealth in that particular country.
According to a 2025 survey by Kantar Emor, 56% of Estonia’s population believe that small loans are granted too easily, and nearly one fifth have taken out a consumer loan in the past three years.8 This raises doubts about the use of possessions as a proxy for wealth. For example, purchasing a PlayStation on instalments does not mean that a family can afford to hire a private mathematics tutor if the child develops learning gaps.
Traditionally, the number of books at home has been treated as an indicator of a strong intellectual environment associated with higher academic achievement. PISA includes a question on how many books pupils have at home, broken down by type, such as religious books, classical literature, scientific books and technical manuals, and by precise ranges of 1–5, 6–10 and more than 10 books. It is questionable whether even the average adult could answer this with such precision.
In PISA, the background questionnaire is generally completed by pupils themselves, while parental questionnaires are voluntary and implemented only in some countries. In a limited number of countries, this has made it possible to compare pupils’ and parents’ responses to questions on socioeconomic background. For items such as books and digital devices, agreement between pupils’ and parents’ responses is below 50%.11 The OECD itself acknowledges this limitation: ‘Direct data collection from parents can be impractical in large-scale studies due to its associated costs. […] Proxy-reporting by pupils about their parents’ occupations and educational attainments is a pragmatic solution, but concerns about the completeness and accuracy of the collected data can be raised.’12
The social component, ‘parents’ occupational status’, is measured on the basis of parents’ occupation and job position. In general, pupils underestimate their parents’ occupational status almost as often as they overestimate it – by 20% and 21%, respectively.13 PISA reports also note that the share of missing and inaccurate data has increased over time. Most frequently, pupils fail to report their parents’ occupation – in the United Kingdom and Germany, this applies to more than 20% of pupils – and non-response is more common among those from weaker socioeconomic backgrounds.14
As for the cultural component, ‘parents’ level of education’, almost one in three pupils provides information that differs from that reported by the parent. Underestimation (18%) is more common than overestimation (13%). Pupils whose parents in fact have a lower level of education tend to overestimate their parents’ educational attainment.15
EDUCATIONAL INEQUALITY IS DEEPENING – REGISTER DATA WOULD HAVE SHOWN THIS SOME TIME AGO
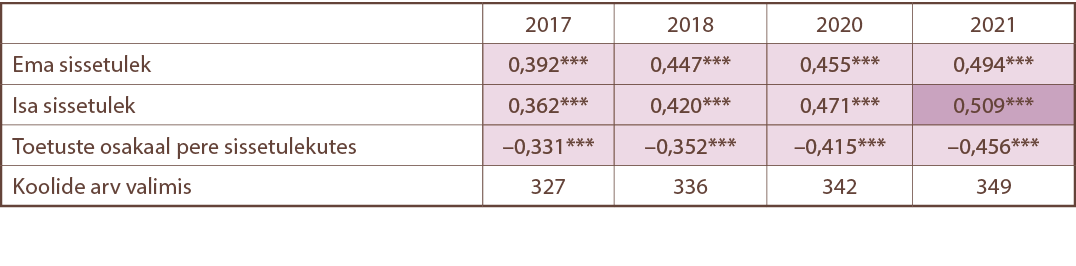
Across Estonia, the association between parental income and schools’ mathematics results has strengthened over time (Table 2.2.2). In 2017, the correlation with mothers’ and fathers’ income was moderate; by 2021, it had become strong. At the same time, the negative association between pupils’ examination results and the share of social benefits in family income has intensified. The higher the proportion of benefits in household income, the lower the school’s average mathematics examination results tend to be.
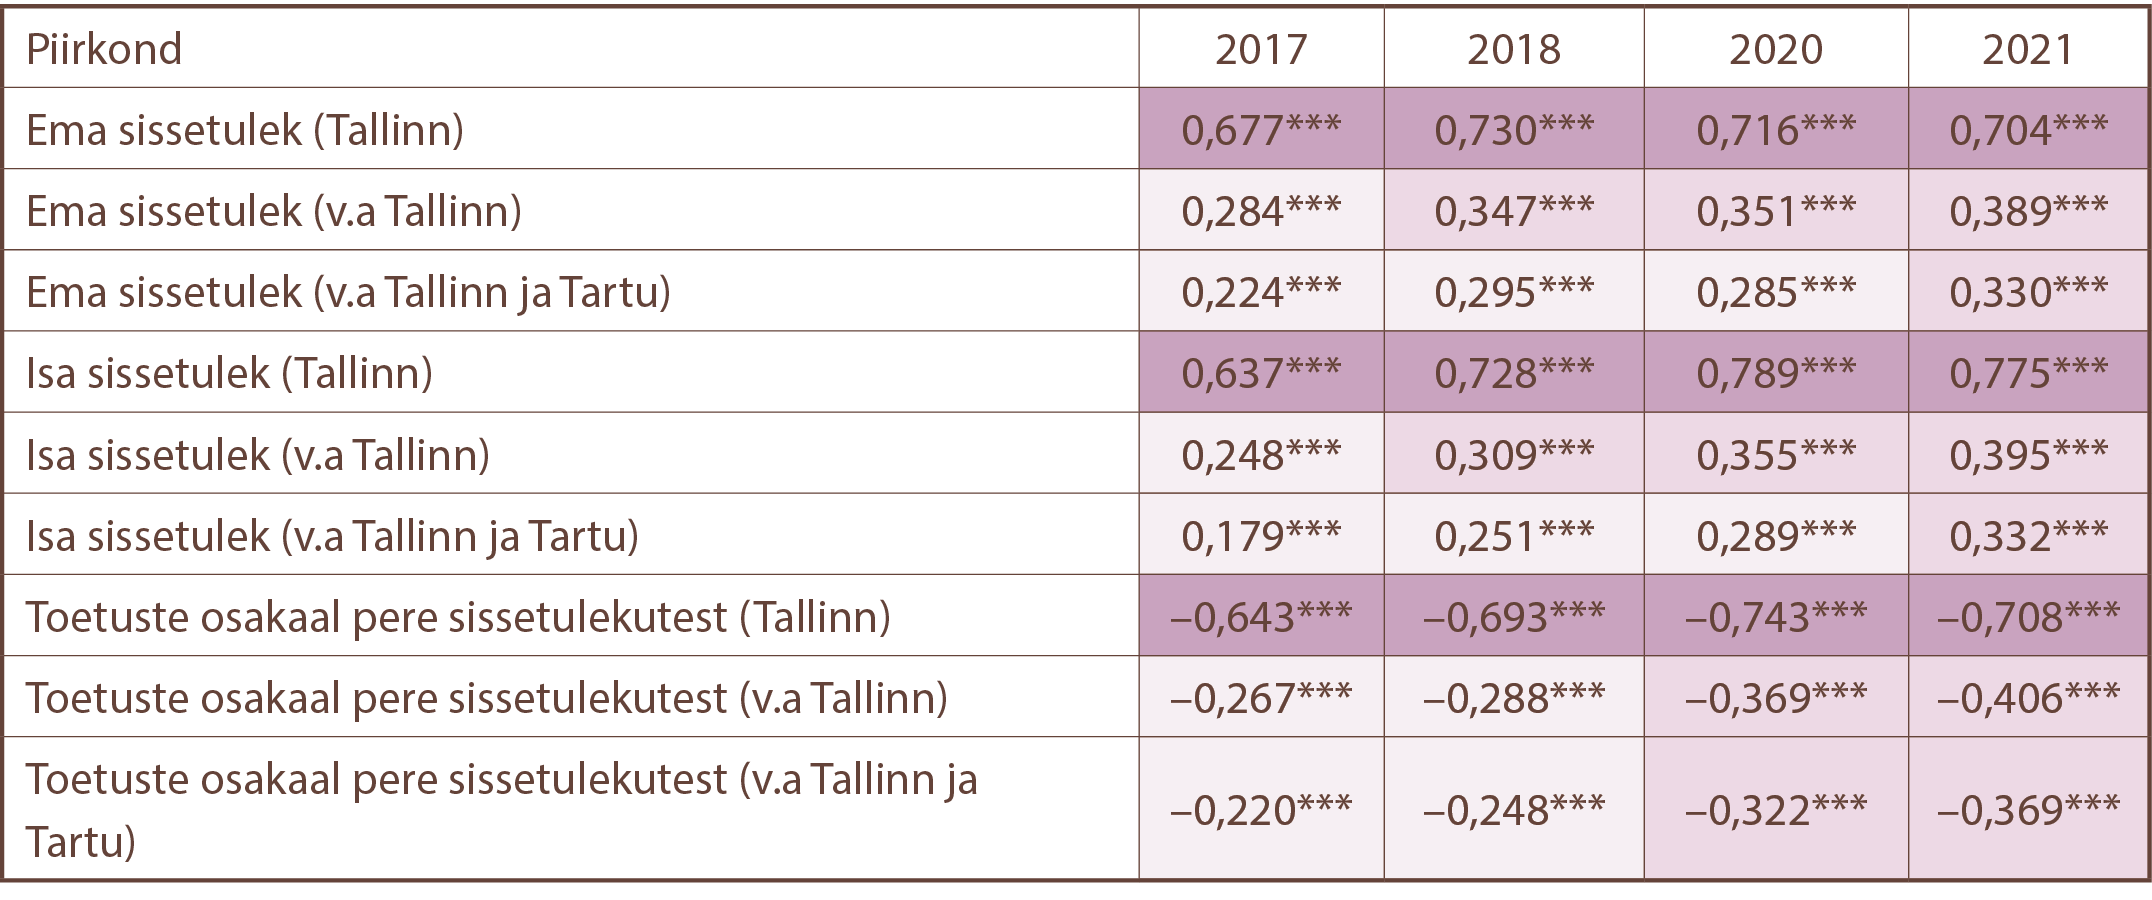
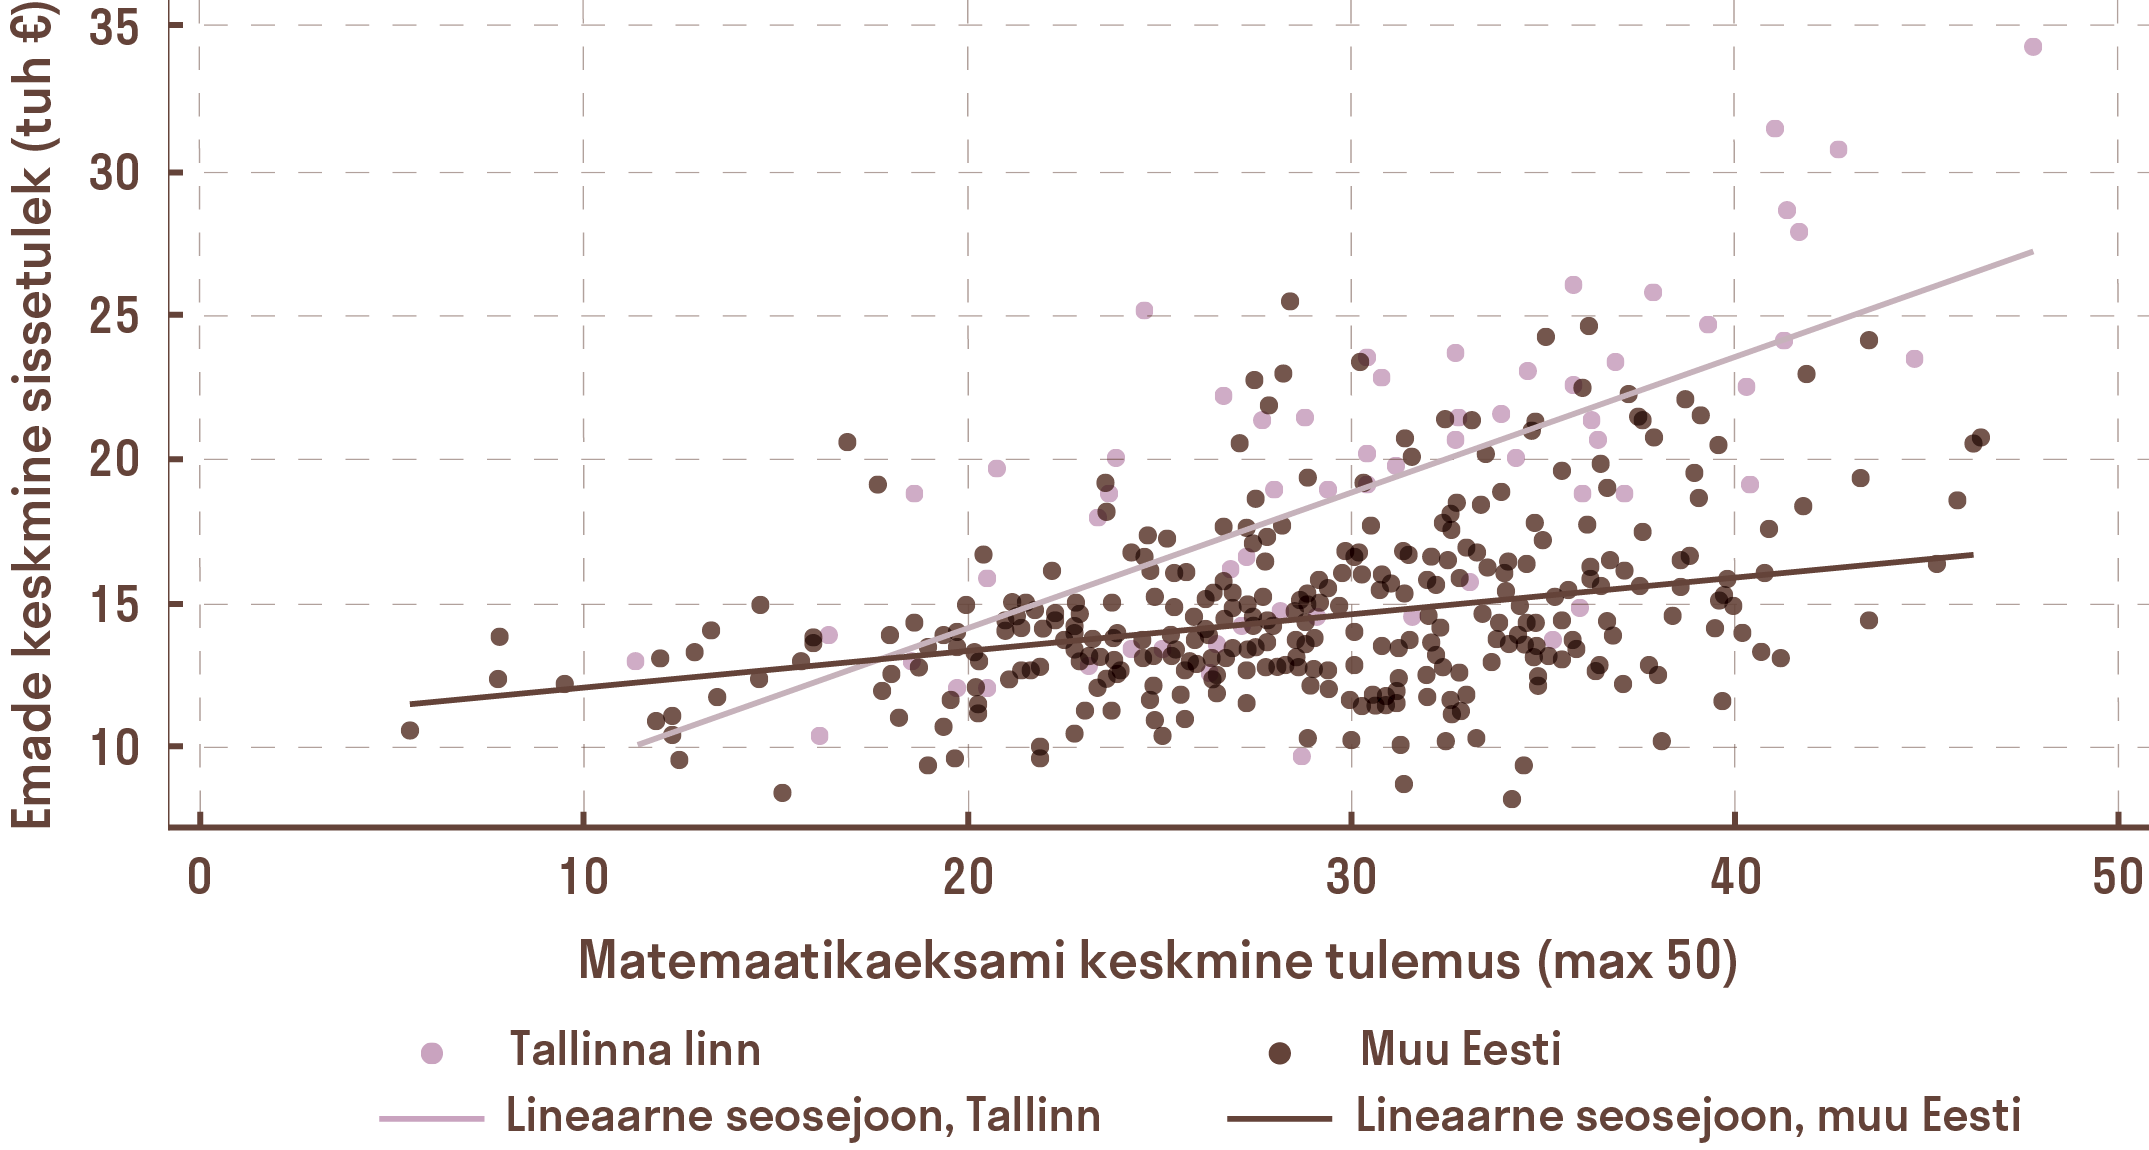
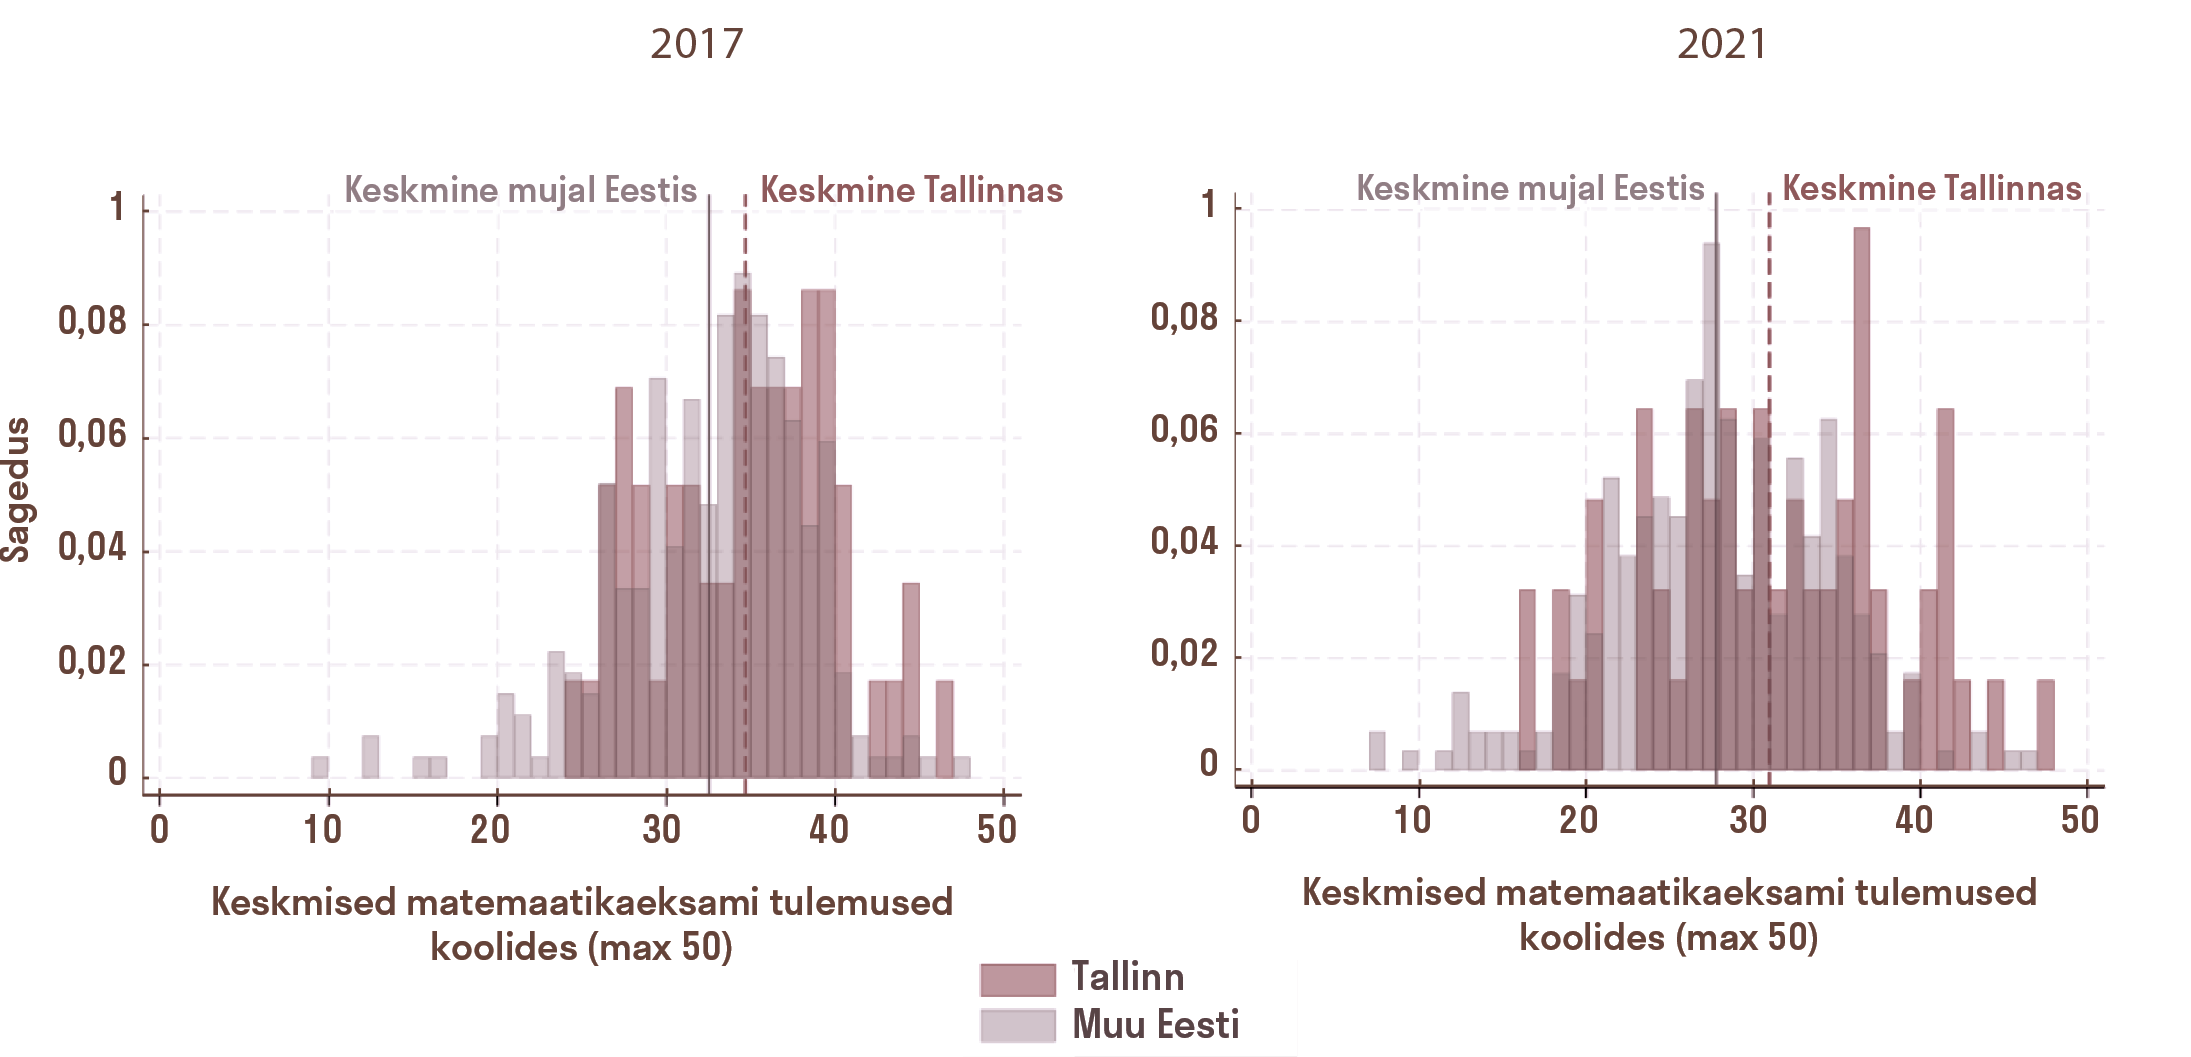
In the capital city, Tallinn, educational stratification has deepened particularly markedly (see Table 2.2.3 and Figure 2.2.1). While the association between a school’s average income of mothers and its average mathematics examination results has remained consistently strong in the capital, the same relationship elsewhere in Estonia has been almost twice as weak and has strengthened only gradually. In 2021, the average income of mothers explained 24% of the variance in lower secondary mathematics examination results across schools in Estonia as a whole; in Tallinn, the figure was 50%, compared with 15% in the rest of Estonia.
Data and methodology. Statistics Estonia’s data on the income of parents (mother, father and total household income) of pupils in Estonian general education schools, as well as the share of social benefits in household income for 2017–2021, were combined with average lower secondary mathematics examination results obtained from the Ministry of Education and Research (EHIS data). The data were linked by Statistics Estonia; researchers received the results in aggregated form, that is, as school-level averages. Time required: 1–2 months for consultations on data protection requirements and six working hours for data linkage (Statistics Estonia). Cost: 360 euros, covering the linkage of datasets from different registers by Statistics Estonia. Sample: Using Estonian register data, it was possible to cover nearly 350 basic schools, where between 12,000 and 14,000 pupils per year sat the mathematics examination and completed Grade 9 in 2017–2021. In those years, approximately 126,000–133,000 pupils were enrolled in basic education, depending on the academic year (population used to calculate average parental income). By comparison, PISA 2022 covered 6,392 pupils in 196 schools. After the initial analysis, the authors also applied to extend the income data series to 2024, but due to stricter data protection requirements this was no longer permitted.
The influence of fathers’ income is even more pronounced in Tallinn: over time, the association between mathematics results and fathers’ income has become very strong in the capital, while elsewhere in Estonia it has remained moderate. This indicates that in Tallinn, school results increasingly reflect parental economic background. A similar pattern is observed in relation to the share of social benefits in household income.
Whereas in 2017 a school’s average mathematics result was largely clustered between 30 and 40 points, by 2021 Tallinn in particular had seen growth at both ends of the distribution – more lower-performing schools (below 20 points) and more higher-performing schools (above 40 points). This points to widening inequality between schools in the capital (Figure 2.2.2). In Tallinn, children living only a few kilometres apart may face markedly different starting points in life: in one school the average mathematics result barely exceeds 20 points, while in another nearby it approaches the maximum.
WHAT MATTERS MORE – PARENTS’ EDUCATION, MONEY OR GENES?
The general premise underlying socioeconomic status indices is that parental education, occupation and economic resources are directly associated with children’s learning outcomes. This is often supplemented by the so-called genetic lottery argument – the assumption that higher-status families also possess more favourable genetic endowments. Let us consider whether the picture is really so clear-cut.
The influence of parental background, and especially educational attainment, on educational outcomes has been debated extensively since 1966, when James S. Coleman and colleagues published the report Equality of Educational Opportunity.16 That study, along with subsequent research, found that alongside school resources, family background and parental education play a significant role in shaping children’s academic achievement.
Should this be the end of the debate – the conclusion that children of more educated parents perform better academically?
It is nevertheless important to remain critically aware of context when invoking older studies – national and societal conditions have changed, particularly when comparing Estonia’s education system with others. Arguments often draw on research conducted in the United States in the 1960s–1980s, which highlighted the decisive role of parental education.17 Yet this effect depends heavily on interactions with other factors – family income, family structure and regional opportunities – which differ today. For example, a highly educated mother raising a child alone may not necessarily be able to offset learning gaps that arise in a low-performing school facing shortages of qualified teachers and support specialists. In short, parents may at times have to compensate for differences in school quality. This does not imply that parental education is unimportant, but it does not explain the full picture, nor why children of less educated parents also reach higher education. What matters more is parental example – the extent to which parents engage with their children and encourage learning.18 Although such support is more often associated with educated parents, it may equally characterise those with lower levels of education.
The genetic lottery argument has also been widely examined: do genes determine a child’s academic success? Genes do play a significant role in explaining differences in mathematical ability and general cognitive capacity.19 However, this does not mean that the environment lacks substantial influence. Nor can it be assumed that only talented or genetically advantaged children are born into wealthier and more educated families. The academic literature recognises the phenomenon of ‘twice-exceptional’ (2e) children – those who are both highly gifted, or have a high IQ, and have special educational needs, such as dyslexia, attention deficit hyperactivity disorder or autism. Research shows that pupils from weaker socioeconomic backgrounds are identified as gifted far less often, meaning that twice-exceptional children from poorer families frequently go unrecognised and unsupported. Giftedness and special educational needs may co-occur and often mask one another, making identification and appropriate support more complex. Studies in the United States indicate that pupils from the highest-income families are identified as gifted six times more often than those from the lowest-income families, which suggests that twice-exceptional children from poorer families face a particularly high risk of being overlooked.20 By neglecting disadvantaged schools and children from weaker socioeconomic backgrounds, substantial talent may be lost in Estonia.
The expression of genetic potential depends to a large extent on the environment, and educational institutions play a central role in this process – schools may function either as a force that mitigates inequality or as a mechanism that reinforces it.21 A school may reinforce inequality if a systemic shortage of qualified teachers and support specialists disproportionately affects schools serving pupils from weaker socioeconomic backgrounds. Relying on the genetic lottery argument effectively downplays the role of school as an environment shaping child development and overlooks children and young people born into poverty who attend schools lacking the skills and resources needed to compensate for their home background.
A higher socioeconomic background also gives families a compensatory advantage.22 A cognitively less capable child born into a more advantaged family is more likely to obtain a good education than a gifted child from a weaker socioeconomic background. Parents may compensate for lower academic performance by providing additional support, such as preparatory schooling or private tutoring.23 They may also help to mitigate obstacles linked to potential genetic risks, including learning or behavioural difficulties.24
A Dutch study involving more than 29,000 pairs of twins found that both family and school socioeconomic background shape the expression of genetic risks, placing children from weaker backgrounds at a double disadvantage.25 Their home environment does not sufficiently offset these risks, and they often attend under-resourced schools. In such cases, a supportive school environment may be decisive. Meta-analyses confirm that a safe school climate, positive relationships with teachers, high expectations and the strengthening of self-confidence can reduce the negative effects of socioeconomic background.26 Dutch data further indicate that when schools raise expectations and self-belief among pupils from weaker backgrounds, the impact is considerably greater than for children from wealthier families.27
Much has been written about pupils’ socioeconomic background as a feature of the home environment, but less attention has been paid to the socioeconomic environment of schools, that is, their resources. While pupils’ socioeconomic background largely reflects parental background, two dimensions can be distinguished at school level: the school’s socioeconomic profile (the aggregate of pupils’ backgrounds) and its internal resources and quality indicators, including the quality of teaching and school leadership. Schools serving pupils from weaker socioeconomic backgrounds often operate with limited resources – shortages of teachers, support specialists and teaching materials are common.28 These schools therefore face a double disadvantage. In Estonia, educational inequality has the face of a child who studies in an under-resourced school and comes from a disadvantaged socioeconomic background. For example, a systemic shortage of subject teachers in certain schools reduces pupils’ opportunities to progress, giving an advantage to those whose parents can provide private tutoring or have relevant subject knowledge themselves. The expansion of so-called shadow education – the private tutoring market – is often an indicator of educational inequality.29
How, then, should we resolve the debate over what is decisive in a child’s development – the mother’s education, family wealth or genes? Education is a complex system in which no single factor determines success: if one link is weak, others must compensate. In Estonia, it is worth asking to what extent disparities in school resources – shortages of teachers and support specialists, limited opportunities to purchase high-quality textbooks or equip laboratories – intensify educational inequality, and whether this increasingly pushes parents to offset school shortcomings through their own spending or through educational mobility, that is, seeking a better school elsewhere.
SUMMARY: HOW DO WE MOVE FORWARD?
In Estonia, there is a clear need to differentiate teachers’ salaries by subject, alongside a strategic focus on improving teaching quality in those subjects. Why is it important to consider subject teachers’ alternative employment opportunities? Research from other countries shows that teachers earn on average 23.5% less than other professionals with the same level of education – a phenomenon known as the teacher pay penalty.30 This gap is most pronounced for science and mathematics teachers, whose skills are in high demand and often better rewarded outside schools. At the same time, in some subjects teaching offers a relative pay advantage and may represent the most attractive career path.
Data on those trained as mathematics teachers in Estonia show that in 2024, a qualified mathematics teacher not working in a school earned approximately 1.6 times as much in Harju County (2,838 euros), 1.4 times as much in Tartu (2,573 euros) and 1.3 times as much elsewhere in Estonia (2,459 euros) compared with the minimum teacher salary (1,820 euros in 2024).31 Research indicates that increasing the salaries of teachers in STEM subjects could reduce their rate of leaving the profession by 18–28%.32 The Basic Schools and Upper Secondary Schools Act provides that knowledge in selected subjects – primarily mathematics, Estonian and a foreign language – is assessed at graduation. The state has therefore already assigned greater importance to certain subjects. These subjects play a decisive role in shaping young people’s subsequent educational pathways.
Data-driven education policy. Estonia has excellent administrative registers for addressing educational inequality in a targeted way, yet for years – if not decades – we have largely relied on conclusions drawn from PISA background questionnaires. This has contributed to a form of PISA blindness in understanding inequality within the education system. Register-based data in Estonia should be used far more decisively to design targeted measures to reduce educational inequality. In analysing inequality, particular attention should be paid to schools’ socioeconomic context – including teacher qualifications and availability, the quality of school leadership, the presence of support specialists and pupil–teacher ratios. However, the potential of Estonia’s e-state in education is limited by insufficient awareness of existing data – we tend to commission new and time-consuming surveys rather than use administrative data – and, even more so, by increasingly stringent data protection requirements.
Systematic use of register data should form the foundation of education policy, both in monitoring developments and in planning reforms. For example, when designing teacher career and salary models, decisions should be based on a comprehensive data-driven assessment rather than on formal qualifications alone. Otherwise, we may end up in a situation where mathematics is taught by a formally qualified history teacher without subject-specific competence, while an experienced engineer with strong teaching skills who wishes to change career is considered less suitable simply because they lack formal teacher certification.
It would also be worth considering linking PISA academic test results with Estonia’s administrative register data in order to analyse the background characteristics of participating schools and pupils’ socioeconomic background, and to track developments over time – for example, what has become of high-performing PISA pupils ten years later, whether school results have improved or declined, and what characterises the schools of top performers. The aim would not primarily be international comparison but a deeper understanding of Estonia’s own education system.
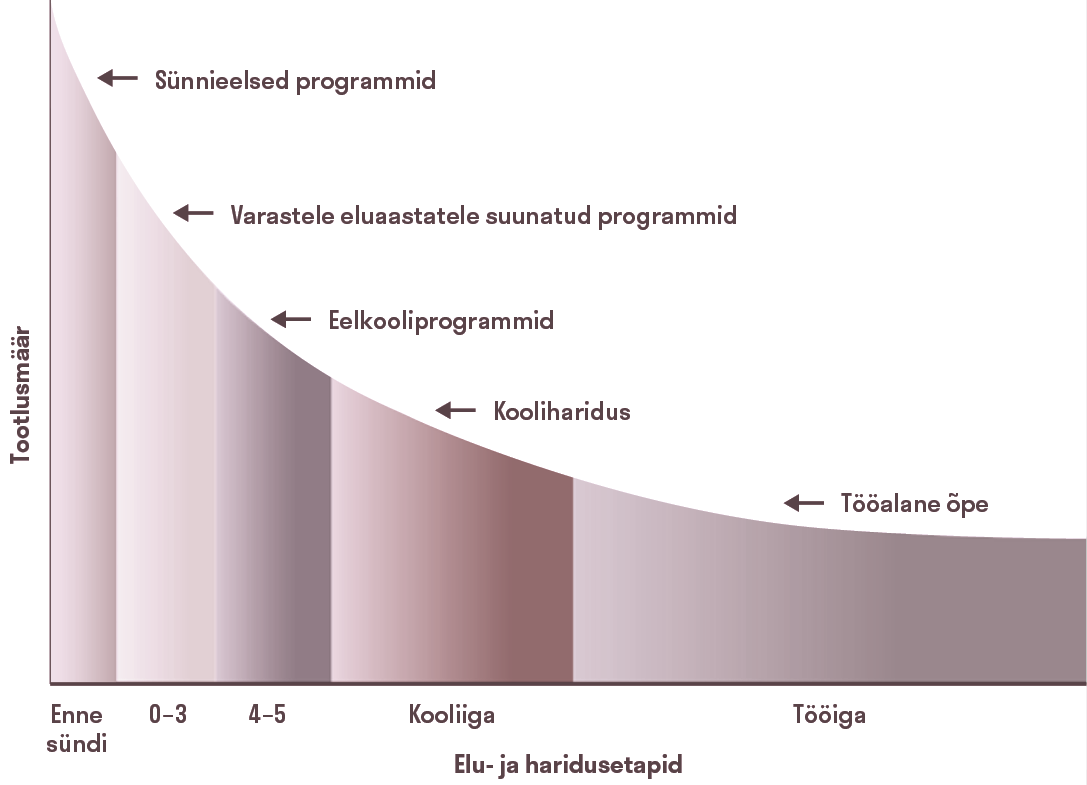
Teacher quality is most decisive for pupils from weaker socioeconomic backgrounds. We must also have the courage to ask what impact a poor teacher or school has on a pupil’s future. Nobel laureate James J. Heckman has emphasised that educational inequality is not only a social issue but also an economic one – supporting disadvantaged children increases societal productivity and reduces future costs, such as unemployment and crime.33 Preventing educational inequality is therefore far less costly than addressing its consequences later. As Heckman’s well-known curve on the rate of return to education investment illustrates (see Figure 2.2.3), public investment in the early development of children from low socioeconomic backgrounds yields the greatest returns.
Research also shows that the impact of pupils’ social background on learning outcomes varies across countries: it depends on age, gender and even subject. In general, home background matters more where the influence of school is weaker (e.g. reading), whereas school quality plays a stronger role in subjects shaped directly by school practice (e.g. mathematics and science).37 For this reason, in Estonia greater attention should be paid to the quality of teaching in STEM subjects – including learning materials, teacher competence and instructional quality, competitive salaries, and class sizes in these subjects. The quality of school leadership must also not be overlooked: even the most capable teachers cannot realise their potential if school management and working conditions are weak.36
