Returns to education
- The economic returns to education in Estonia are below the international average. Within Estonia, however, they are higher for women than for men and higher for those born in the 1970s – the so-called ‘generation of winners’ – than for other cohorts.
- Returns to work experience are also lower than the international average; an additional year of education yields a higher return than an additional year of experience.
- The ethnic wage gap is reflected in both returns to experience and returns to education – members of minority ethnic groups in Estonia receive lower returns to both.
- Among older cohorts, returns to education are higher for ethnic Estonians, whereas among younger cohorts the opposite applies – minority groups receive higher returns than ethnic Estonians.
- The ethnic wage gap is smaller among younger cohorts and amounts to only 3% for those born in the 1990s.
INTRODUCTION
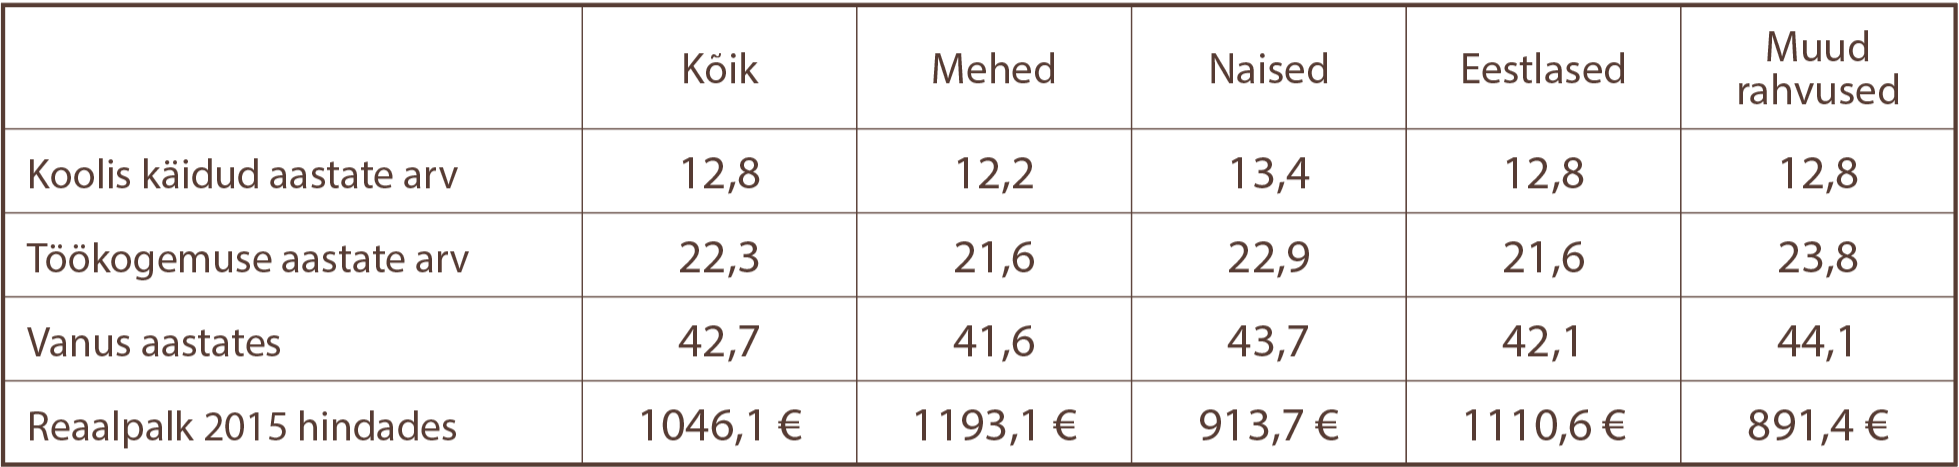
In this article, we use Estonian register data to estimate the wage increase associated with each additional year of schooling and with each additional year of work experience, referred to in economics as the return to education and the return to experience, respectively. Here, ‘return’ denotes the wage growth associated with an additional year of schooling or experience, without distinguishing whether the wage premium arises from education and labour market participation themselves or from more able individuals pursuing longer education and more continuous working careers. We estimate returns to education and experience for all individuals who received official wage income in Estonia between 2006 and 2024, and estimate returns to education separately by socio-demographic characteristics such as gender, ethnicity and birth cohort. The estimates are based on the Mincer methodology, described in more detail in the text box at the end of the article.
AN ADDITIONAL YEAR OF EDUCATION IS ASSOCIATED WITH AN 8–10% WAGE PREMIUM IN INTERNATIONAL STUDIES
One of the central questions in labour economics is why workers are paid differently, both across and within countries. Human capital theory explains these differences by arguing that investments in education and work experience increase individual productivity and, in turn, wages.1 Human capital comprises three main components: knowledge and social skills acquired in early childhood; formal education; and skills developed through work experience. Studies suggest that at least one-third of wage differences within a country can be attributed to differences in human capital.2
Nobel laureate James Heckman has examined the role of knowledge and skills acquired in early childhood and argues that this component makes the largest contribution to earnings among the three.3 Based on genetic studies and experimental evidence from the United States, he concludes that environmental factors play a greater role in the formation of human capital than genetics. Supporting child development at an early age improves both academic ability and other skills required in working life, such as communication and concentration. Early interventions, such as providing an enriching and secure environment in early childhood, help reduce income disparities later in life.
There are several methods for estimating returns to education. The most widely used is regression analysis based on the Mincer wage equation, which measures how years of schooling are associated with wages. These estimates also control for work experience, meaning that individuals with similar levels of experience are compared. International studies covering a large number of countries show that each additional year of education is associated with wages that are 8–10% higher on average.4 The level of returns to education is not systematically related to a country’s income level and is similar, on average, in both developing and developed economies.5
The positive association between education and wages does not necessarily imply that wages always increase with each additional year of schooling. The relationship reflects both the effect of education in raising human capital and the tendency of more academically able individuals to choose longer educational paths. However, studies using methods designed to identify the causal effect of education on wages likewise find that an additional year of schooling raises wages by around 10% on average – a result close to estimates based on the Mincer wage equation.6
Returns to education vary considerably across population groups. International evidence shows that they are not uniform across levels of education: individuals who attain tertiary education usually enjoy higher returns to education than those with lower levels of educational attainment. An analysis of 145 countries by Jedwab et al. finds that the difference is nearly twofold – average returns are around 13% for workers with higher education, compared with about 7% for those with lower levels of education.7 The same study shows that in former socialist countries, returns to education and work experience are relatively low, as qualifications and experience acquired under central planning became partly obsolete during the transition to a market economy.
IN ESTONIA, AN ADDITIONAL YEAR OF EDUCATION IS ASSOCIATED WITH A 6% WAGE PREMIUM, AND RETURNS ARE HIGHER FOR WOMEN THAN FOR MEN
In Estonia, as in other post-socialist countries, returns to education are below the international average. Over the period 2006–2024, each additional year of education was associated with an average wage premium of 6%. As noted above, international estimates based on data covering most countries place returns to education in the range of 8–10%.
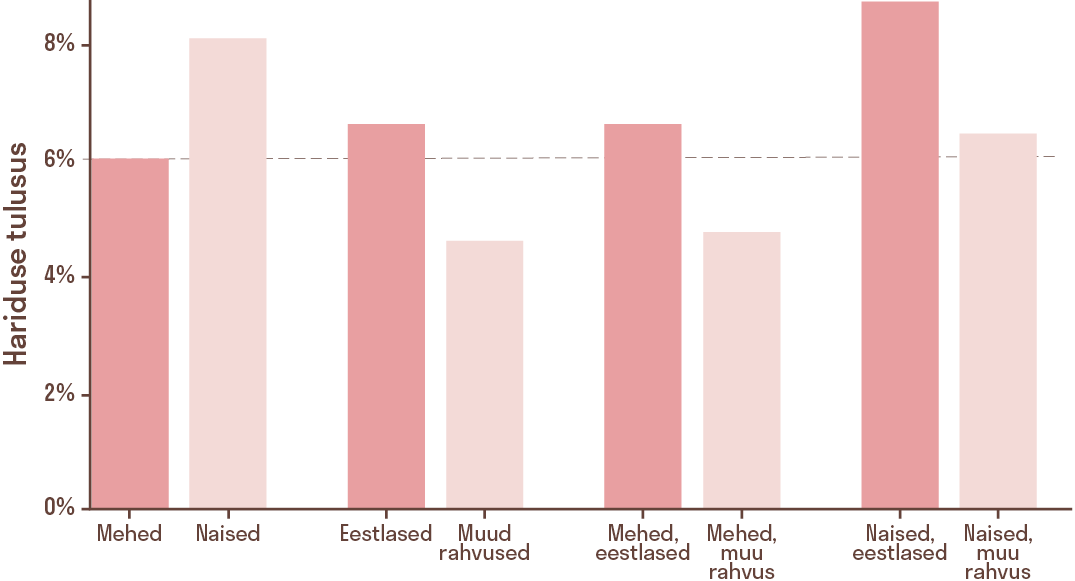
Internationally, returns to education are generally higher for women than for men. A recent study covering 165 countries reports average returns of 11% for women and 9% for men.8 A similar pattern is observed in Estonia: returns to education are estimated at 8% for women and 6% for men.
We also estimated returns to education by ethnicity (ethnic Estonians and individuals of other ethnic backgrounds). Figure 3.1.1 shows that returns to education are higher for ethnic Estonians than for other ethnic groups in Estonia. A substantial share of non-Estonians consists of individuals who migrated to Estonia from other parts of the Soviet Union before the transition to a market economy. The results suggest that the loss of human capital associated with this transition was greater for them than for ethnic Estonians. Limited proficiency in Estonian likely further constrained the transferability of previously acquired skills. Earlier studies indicate, however, that language proficiency alone does not fully account for wage differences.9
In Estonia, returns to education are higher for women than for men across ethnic groups. Among the groups shown in Figure 3.1.1, returns are lowest for non-Estonian men and highest for ethnic Estonian women.
AN ADDITIONAL YEAR OF WORK EXPERIENCE AFFECTS WAGES LESS THAN AN ADDITIONAL YEAR OF EDUCATION
As with education, wages rise with additional work experience, but the effect of an extra year of experience is smaller than that of an extra year of education. Estimates based on the Mincer wage equation show that, internationally, each additional year of work experience is associated with an average wage increase of 2%, with lower returns in developing countries (1.7%) than in developed countries (3.2%).10 The marginal effect of experience declines over the life cycle: it is strongest in the early years of employment, but weakens later and may eventually turn negative.11
As with returns to education, returns to work experience in Estonia are below the international average and are closer to those observed in developing than in developed countries. In the period 2006–2024, an additional year of work experience in Estonia was associated with an average wage increase of 1.6%.
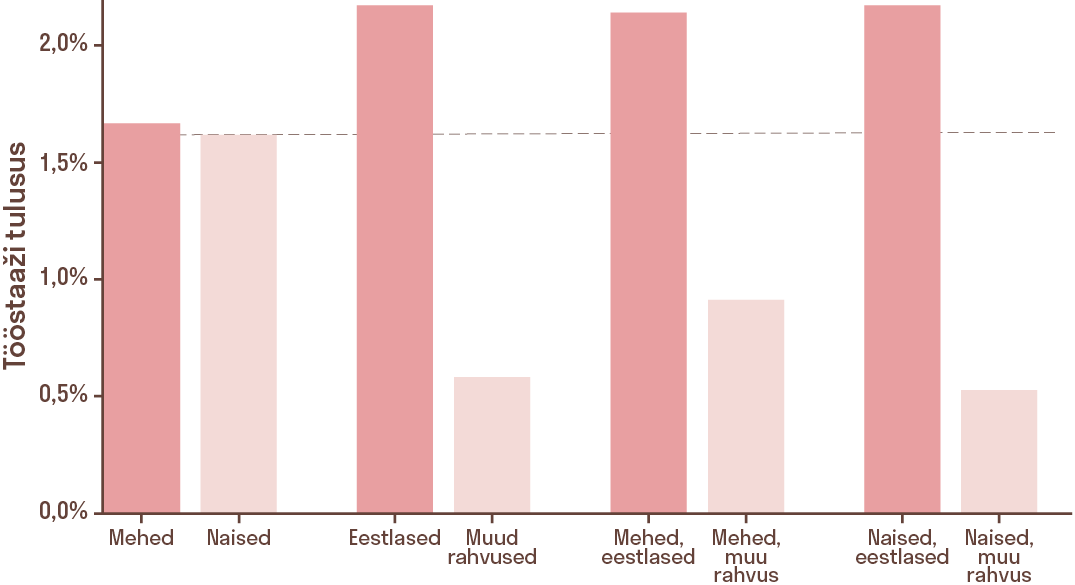
We also estimated returns to work experience in Estonia for four groups, defined by gender (women and men) and ethnicity (ethnic Estonians and others). The results are presented in Figure 3.1.2. For the population as a whole, returns to work experience are similar for women and men. The same pattern holds among ethnic Estonians. Among other ethnicities, however, returns are lower for women than for men.
Although gender differences in returns to an additional year of experience are small, differences by ethnicity are pronounced. For ethnic Estonians, an additional year of work experience is associated with an average wage premium of 2.2%, compared with 0.6% for individuals of other ethnicities – a difference of nearly three times.
RETURNS TO EDUCATION ARE HIGHEST FOR THE SO-CALLED ‘GENERATION OF WINNERS’
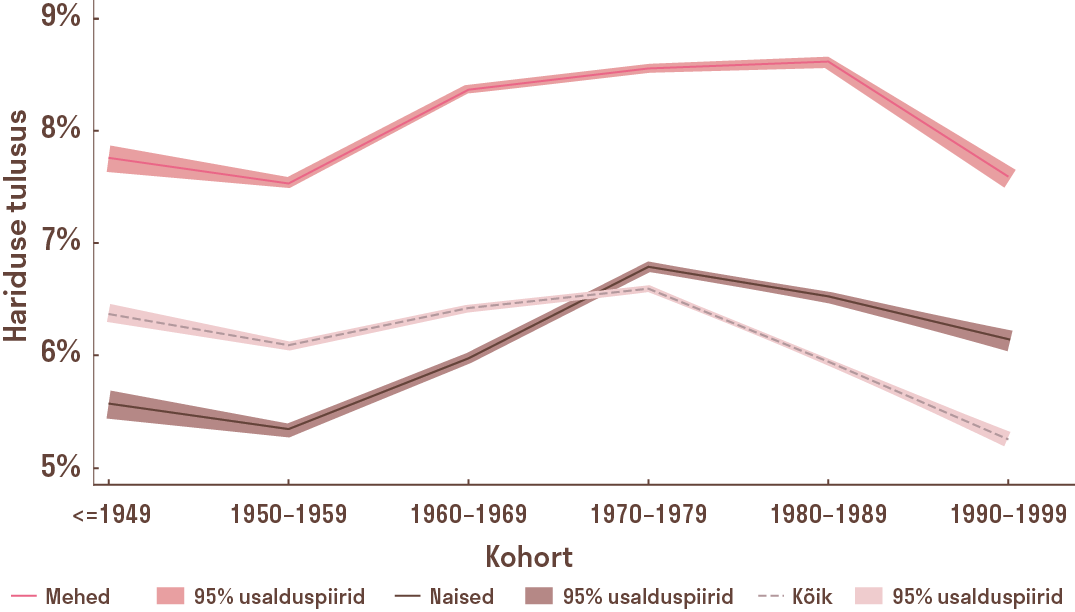
We next estimated returns to education by age group, distinguishing six birth cohorts (1949 or earlier, 1950–59, 1960–69, 1970–79, 1980–89 and 1990–99). Controls for work experience were excluded from this analysis, as the experience variable is derived from the employee’s age. Figure 3.1.3 shows that returns to education are highest among those born in the 1970s – the so-called ‘generation of winners’. When analysed separately by gender, this cohort effect is particularly pronounced among men: returns to education are clearly highest for men born in the 1970s compared with other cohorts. Among women, returns are consistently high for those born in the 1960s, 1970s and 1980s.
What distinguishes those born in the 1970s from other cohorts? They attained tertiary education – higher education or vocational education – during the economic transition of the 1990s and were therefore the first to receive a Western-oriented education. This provided an advantage both in accessing jobs and in applying newly acquired knowledge. For younger age groups, however, this education-related advantage no longer yielded equally high returns in the labour market. Over time, the relative advantage of the ‘winner generation’ has diminished, and among those born in the 1990s, returns to education are even lower than among those born in the 1950s and 1960s, when considering the population as a whole.
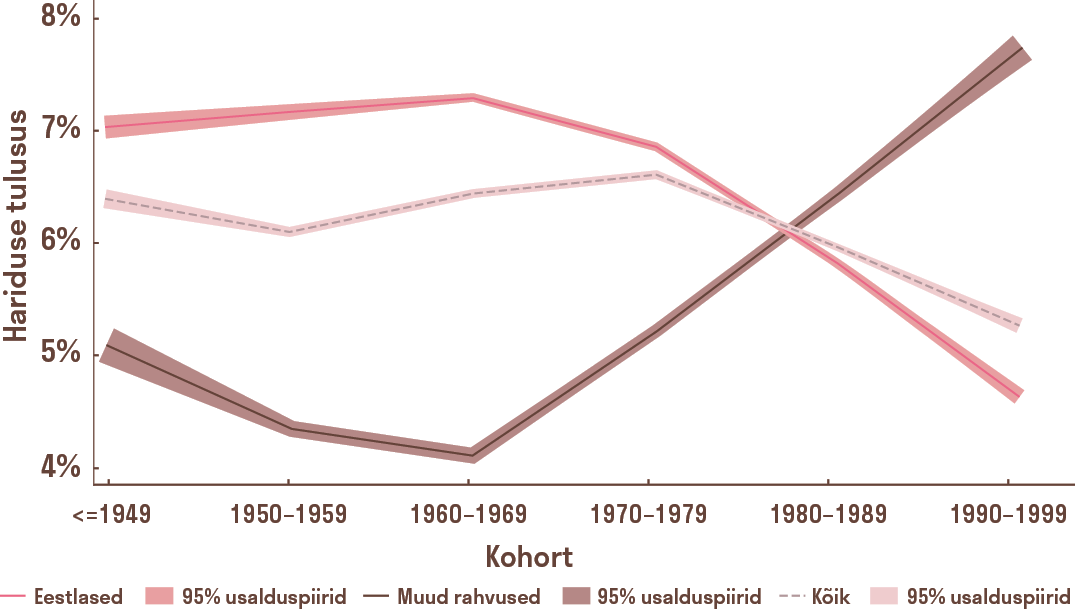
RETURNS TO EDUCATION ARE LOWER AMONG ESTONIANS BORN SINCE THE 1980S THAN AMONG OTHER ETHNIC GROUPS
While education has generally yielded higher returns for Estonians than for individuals of other ethnic groups, the age-cohort profile of returns differs markedly across groups. Among ethnic Estonians, returns to education decline in younger cohorts, whereas among minority groups they increase (Figure 3.1.4). In the two youngest cohorts, returns are higher for minority groups than for ethnic Estonians, and the gap is widening. This suggests that younger individuals from minority backgrounds gain more from additional education than their ethnic Estonian peers.
By contrast, the loss of human capital associated with the transition to a market economy is more evident among older non-Estonians. The largest ethnic gap in returns to education, in favour of ethnic Estonians, is observed among those born in the 1960s – the cohort that completed its education immediately before the transition period of the 1990s.
GENDER AND ETHNIC WAGE GAPS DECLINE AS MORE EQUAL COHORTS ENTER THE LABOUR MARKET
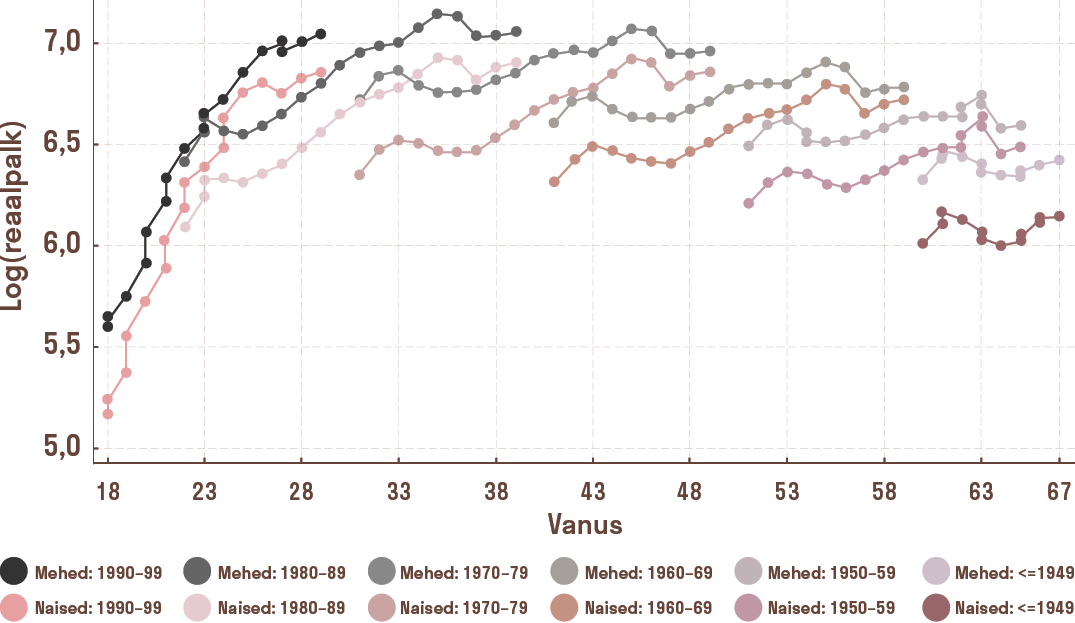
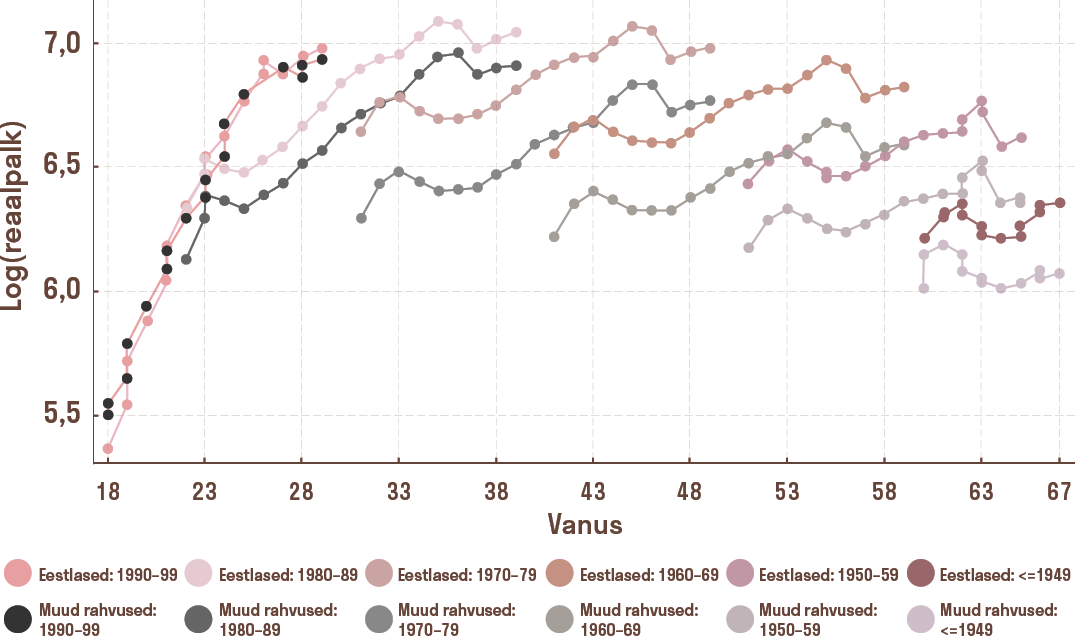
The preceding analysis showed that returns to education differ by gender and ethnicity, and that cohort trends move in opposite directions across ethnic groups. Among ethnic Estonians, returns to education decline in younger cohorts, whereas among minority groups they increase. In the two youngest cohorts, returns for non-Estonians exceed those for ethnic Estonians, suggesting improved career prospects and employment opportunities for younger non-Estonians. Does this translate into narrower wage gaps? To examine this, we calculated cohort-based wage levels by gender (women and men) and ethnicity (ethnic Estonians and minority groups). We estimated log real wages, grouped individuals by decade of birth, and calculated average wage levels for each cohort across different ages. The results are presented in Figures 3.1.5 and 3.1.6.
The figures show that both gender and ethnic wage gaps are persistent within cohorts over time: where the gap is large at the beginning of the observation period in 2006, it remains large throughout. The gender wage gap narrows somewhat within cohorts as experience accumulates, but the ethnic wage gap remains highly persistent.
The overall decline in wage gaps is therefore driven mainly by the entry of younger cohorts, among whom the gaps are smaller. The gender wage gap decreases slowly across successive cohorts, whereas the decline by ethnicity is more pronounced. Among those born in the 1980s, the ethnic wage gap is already substantially smaller than in earlier cohorts, and among those born in the 1990s it has almost disappeared: the average wage gap across all observed years for this group is only 3%.
SUMMARY
The loss of human capital during the transition period affected ethnic minority groups in Estonia particularly strongly. Over time, however, this effect has diminished, and for the generation born in the 1990s labour market opportunities are now similarly favourable regardless of ethnicity. Higher returns to education for women also help explain their greater representation among those with higher education.
Returns to education and work experience in Estonia are below the international average. Similar patterns have been observed in other post-socialist countries, reflecting the legacy of the socialist system and the transition from a planned to a market economy, which rendered part of the pre-1990 stock of knowledge and skills obsolete. This loss of human capital disproportionately affected minority groups, whose returns to both education and work experience remain lower than those of ethnic Estonians.
At the same time, the ethnic gap in returns to education narrows across cohorts. It is largest among those born before the 1960s, decreases in younger cohorts, and from the cohorts born in the 1980s onwards returns to education are higher for minority groups than for ethnic Estonians. This suggests gradual but consistent economic integration. While older ethnic Estonians tend to have better employment prospects and higher wages on average than non-Estonians, younger ethnic minorities are just as successful in the labour market as their Estonian peers. Cohort-based estimates further show that the ethnic wage gap narrows over time and, among those born in the 1990s, has fallen to only a few percentage points.
Returns to education are higher for women than for men. This difference has been highly persistent over time and is consistent with findings from other countries. Given that Estonia’s gender wage gap is among the largest in Europe, higher levels of educational attainment play an important role in reducing women’s risk of in-work poverty and inequality. In this sense, women’s investment in education represents a rational economic choice. Between 2006 and 2024, two-thirds of university graduates in Estonia were women.12 Lower returns to education for men make additional years of study less financially rewarding, and shorter educational trajectories may partly reflect the smaller gains men obtain from further education compared with women. At the same time, the large gender gap in educational attainment is a major challenge for Estonian society. As the share of women among higher education graduates has remained consistently high for several decades, a rapid narrowing of the education gap is unlikely without systematic and targeted measures to increase the proportion of men completing higher education.
Data and methodology. The Mincer wage equation measures the relationship between wages and years of schooling and work experience. The dependent variable is the logarithm of wages, and the explanatory variables are years of schooling, work experience and its square, and year dummy variables. This approach is widely used in economics to estimate returns to education.13 The Mincer wage equation is specified as follows:
lnWit= α + β Eduit+γ Expit+δ Exp2it+τt +εit
The dependent variable, lnWit, is the logarithm of monthly gross wage. We focus on labour income, which includes remuneration of management board members. Education, Eduit, measured in years of schooling, is derived from the education level reported in the population census. The education variable is taken from the 2021 census; if a worker’s education is not recorded there, earlier census data are used. Work experience, Expit, is calculated based on age and years of schooling. In our estimates for Estonia, as in international studies, data on actual work experience are unavailable, so potential work experience is used instead. We assume that individuals with higher education enter the labour market after completing their studies, and that those with upper secondary or lower education enter at age 18. For workers with higher education, schooling is assumed to begin at age seven. These assumptions follow standard practice in similar studies.14
In presenting the results, we report the effect of work experience as γ + δ × (median experience). As is standard in the literature, returns to work experience are estimated as a quadratic function.15 The effect of work experience on wages is non-linear and depends on the amount of experience already accumulated. Year dummy variables (τt) are included
to control for cyclical economic effects and other macro-level influences. Estimation is carried out using ordinary least squares (OLS) regression.
We use register data on wage income (TSD) from the Estonian Tax and Customs Board for 2006–2024 and population census data for 2000, 2011 and 2021. The TSD data do not contain information on hours worked, so labour income reflects monthly earnings rather than hourly wages. For each year, we use October wage data, as this month typically excludes holiday and bonus payments and is commonly used in empirical research. To ensure comparability across years, wages are converted into real terms using the consumer price index, with 2015 as the base year.